
Comparison of Filled Slice Coloring
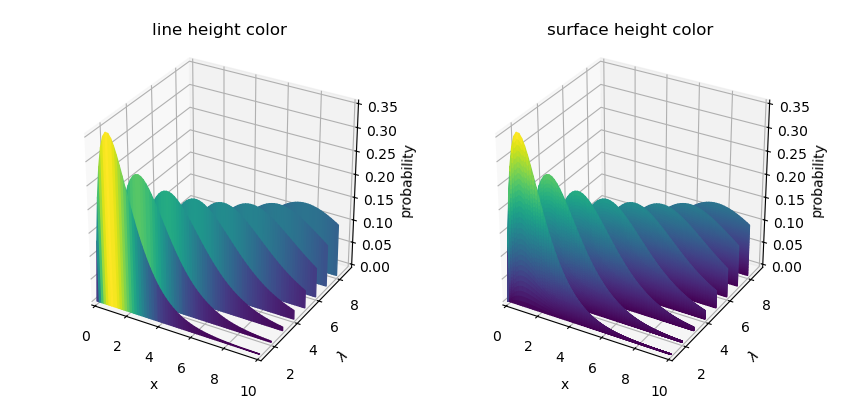
These two examples show the two methods of coloring a filled slice surface:
using the color of the colored line slice.
directly coloring the surface using the surface method.
Note
When the surface coloring varies in the z-direction, the surface should first be subdivided using the lrez argument, as shown in the highlighted line below. This is needed to form multiple surface faces in the z-direction.
The Filled 3D Line Graph example shows colormapping in the λ direction.
import numpy as np
from matplotlib import pyplot as plt
import s3dlib.surface as s3d
from scipy.stats import poisson

# 1. Define function to examine .....................................

# Fixing random state for reproducibility
np.random.seed(19680801)

def poisson_function(xyz) :
    x,y,z = xyz
    Z = poisson.pmf(y, x)
    return x,y,Z

# 2. Setup and map surfaces .........................................
rez=5

line = s3d.ParametricLine(rez)
line.map_xySlice_from_op( poisson_function, yset=8, xlim=(0,10), ylim=(1,8) )
line.map_cmap_from_op( lambda xyz: xyz[2],'viridis')

surfaces = [None]*2

surfaces[0] = line.get_filled_surface(name='line height color')

surfaces[1] = line.get_filled_surface(lrez=5,name='surface height color')
surfaces[1].map_cmap_from_op( lambda xyz: xyz[2],'viridis')

# 3. Construct figures, add surface, plot ...........................

fig = plt.figure(figsize=(8.5,4))

for i,surface in enumerate(surfaces)  :
    ax = fig.add_subplot(121+i, projection='3d', aspect='equal')
    ax.set(xlim=(0, 10), ylim=(1, 9), zlim=(0, 0.35),
        xlabel='x', ylabel=r'$\lambda$', zlabel='probability')
    ax.set_title(surface.name,  fontsize='large')

    ax.add_collection3d(surface)

fig.tight_layout(pad=2)
plt.show()