
Line Slices
Functional plots for z = f(x,y) of lines of constant x or y.
Datagrid slices along constant x and y planes.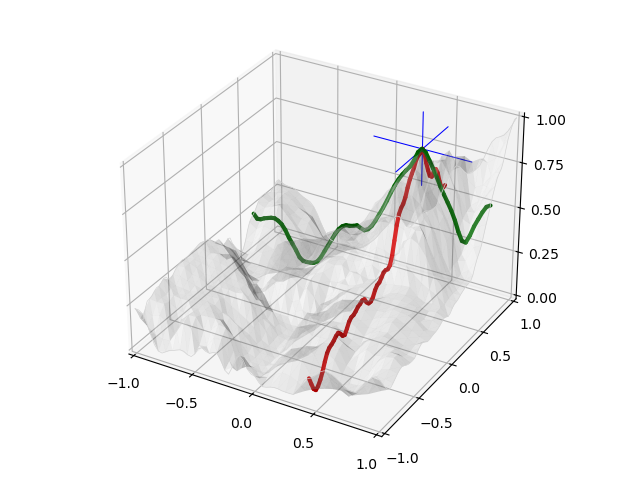
Datagrid XY Slices
Example of a parametric line slice set.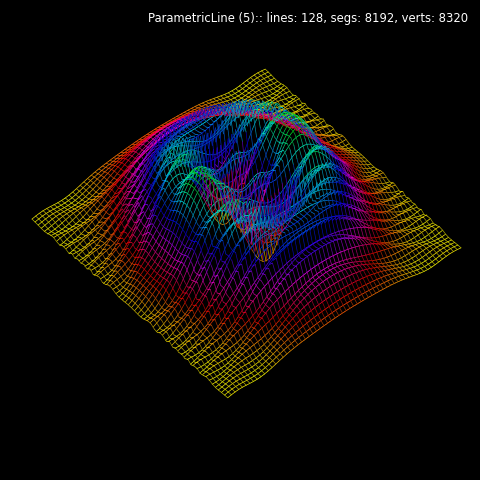
Line Slice Wireframe Plots
Datagrid slices and filled slices along with coloring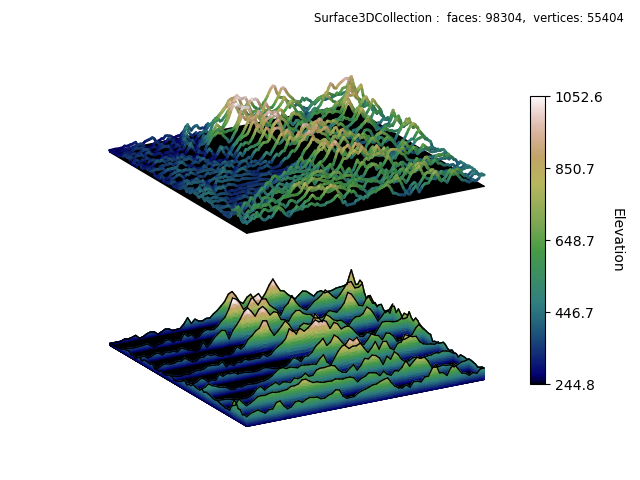
Slice and Filled Slice Datagrid
Comparison of visualizations from contours and slices.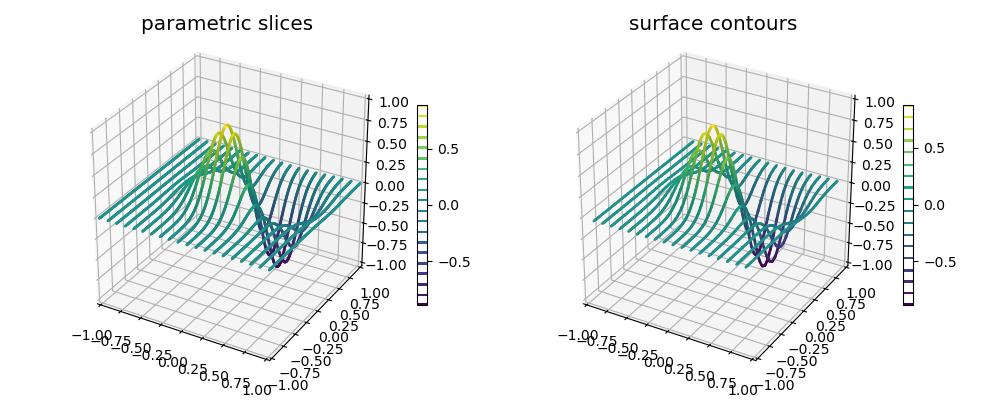
Parametric Slices and Surface Contours
Comparison between coloring methods for slices.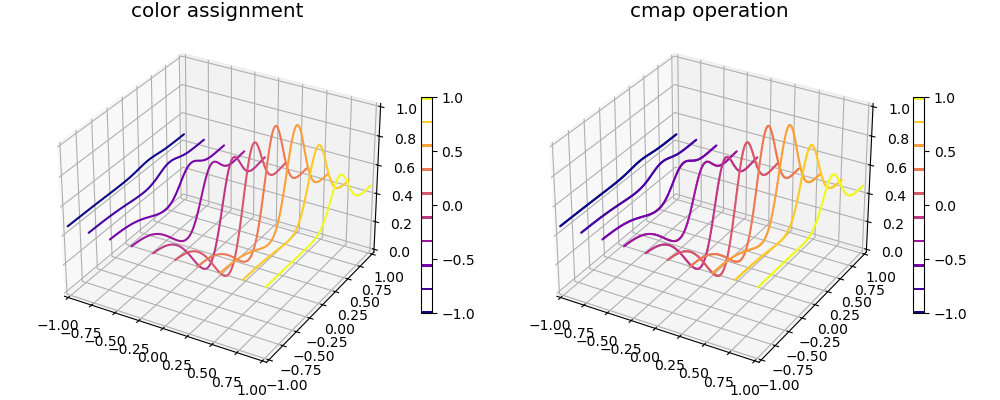
Color Assignment and Colormap Slices
Demonstration of four different methods for coloring xy slice sets.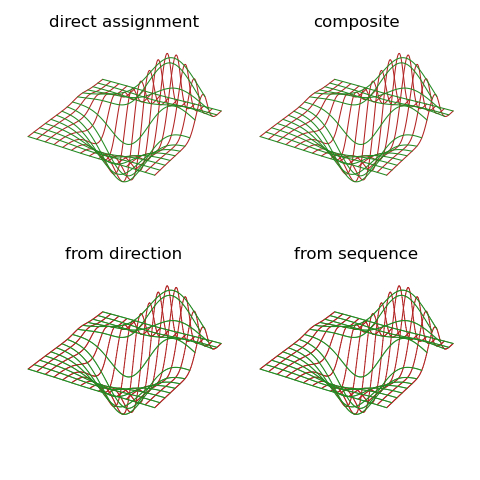
Surface Slice Color Methods
A datagrid and a function used for both geometry and colormapping.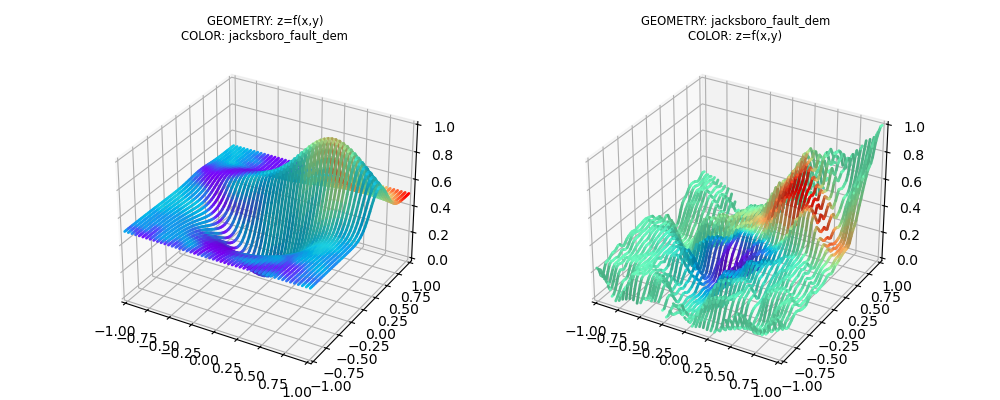
SliceSet Geometry and Color
Filled slices, colored from the line colors.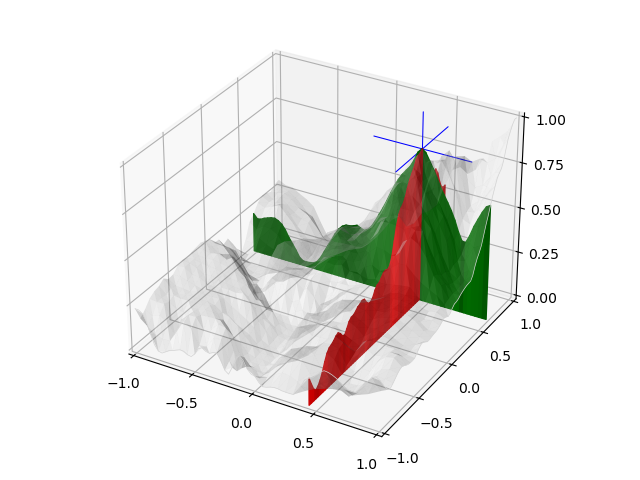
Datagrid XY Filled Slices
Two methods of coloring slice planes.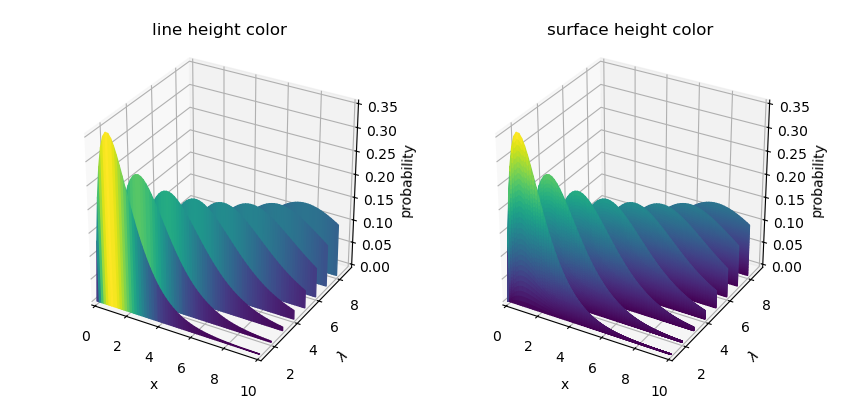
Comparison of Filled Slice Coloring
Combination of both x and y slice line filled surfaces.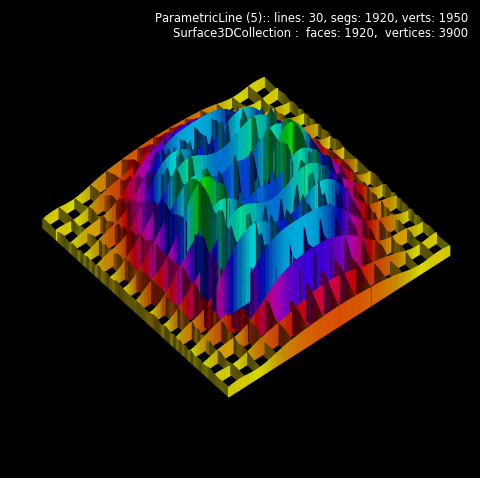
Multiple X and Y Slice Surfaces