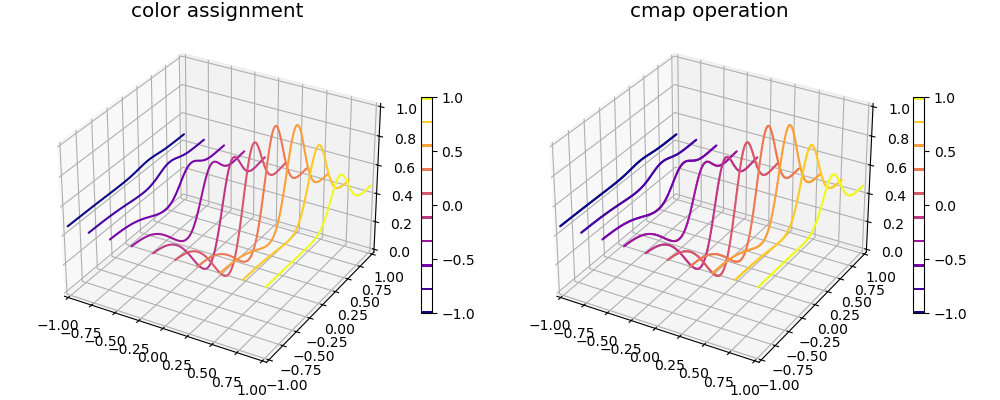
Color Assignment and Colormap Slices

This example demonstrates two methods of applying identical surface coloring. The comparison is similar to the Segmented Cmap Operation example, showing a similar comparison between direct color assignment and using a color map.
Note: in the highlighted line, the colormap is assigned in the constructor even though it is NOT used for color. The reason is that the colorbar uses the object colormap for display. If not assigned, the default colormap will be used for the colorbar.
import numpy as np
import matplotlib.pyplot as plt
from matplotlib import colormaps
from mpl_toolkits.mplot3d import axes3d
import s3dlib.surface as s3d

#.. Segmented Cmap Operation for Lines Slices

# 1. Define function to examine .....................................

X, Y, Z = axes3d.get_test_data()

# 2. Setup and map surfaces .........................................
rez=6

tenColors = colormaps['plasma'](np.linspace(0, 1, 10))
line1 = s3d.ParametricLine(rez,color=tenColors,name="color assignment",cmap='plasma')
line1.map_xySlice_from_datagrid(Z,  xset=10)

line2 = s3d.ParametricLine(rez, cmap='plasma',name="cmap operation")
line2.map_xySlice_from_datagrid(Z,  xset=10)
line2.map_cmap_from_op(lambda xyz: xyz[0])

# 3. Construct figure, add surface, plot ............................

lines = [ line1, line2 ]

fig = plt.figure(figsize=(10,4))
for i,line in enumerate(lines) :
    ax = fig.add_subplot(121+i, projection='3d')
    ax.set(xlim=(-1,1), ylim=(-1,1), zlim=(0,1) )
    ax.set_title(line.name, fontsize='x-large')
    plt.colorbar(line.stcBar_ScalarMappable(10,'w'), ax=ax,  shrink=0.6 )

    ax.add_collection3d(line)

fig.tight_layout()
plt.show()
