
Parametric Slices and Surface Contours
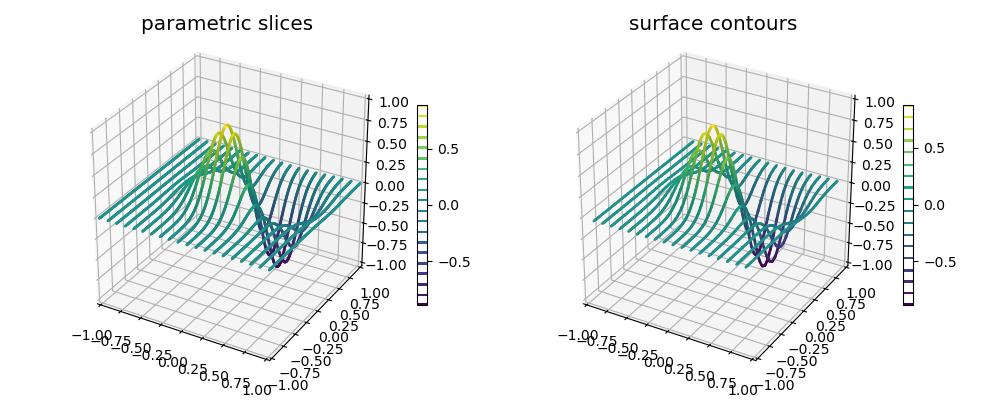
Contours and slices can produce similar visualizations for planar surface z=f(x,y). The difference is the resolution control for the lines. For slices, line segment size is controlled by the rez of the of the ParametricLine object. For contours, the line segments are determine by the rez of the surface from which the contours are computed.
import numpy as np
import matplotlib.pyplot as plt
import s3dlib.surface as s3d
from matplotlib import cm

# comparison between slices and contours

# 1. Define function to examine .....................................

def geo_map(xyz) :
    x,y,z = xyz
    X,Y = 3*x, 3*y
    Z1 = np.exp(-X**2 - Y**2)
    Z2 = np.exp(-(X - 1)**2 - (Y - 1)**2)
    Z = Z1-Z2
    return x,y,Z

# 2. Setup and map surfaces .........................................
numbLines = 18

# method 1: parametric slices definition..............
rez=7
para_line = s3d.ParametricLine(rez, name="parametric slices")
para_line.map_xySlice_from_op( geo_map, xset=numbLines+2 )

# method 2: surface contours definition..............
rez = 5
surface = s3d.PlanarSurface(rez)
surface.map_geom_from_op( geo_map )
cont_line = surface.contourLineSet(numbLines, direction=[1,0,0] )
cont_line.name = 'surface contours'

# 3. Construct figure, add surface, plot ............................
lines = [ para_line, cont_line ]

fig = plt.figure(figsize=(10,4))
for i,line in enumerate(lines) :
    ax = fig.add_subplot(121+i, projection='3d', aspect='equal')
    line.map_cmap_from_op(lambda xyz: xyz[2])
    line.shade(.7).set_linewidth(2)
    ax.set(xlim=(-1,1), ylim=(-1,1), zlim=(-1,1) )
    ax.set_title(line.name, fontsize='x-large')
    nLin = numbLines if i==1 else numbLines+2
    plt.colorbar(line.stcBar_ScalarMappable(nLin,'w'), ax=ax,  shrink=0.6 )

    ax.add_collection3d(line)

fig.tight_layout(pad=2)
plt.show()