
Surface Slice Color Methods
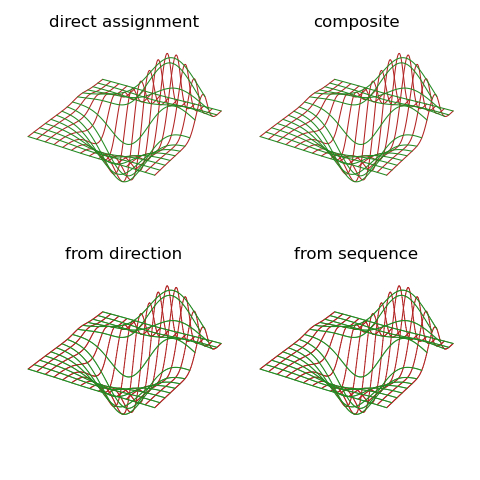
The ‘composite’ method is the most direct method and easiest to interpret from the script, not needing the construction of a colormap or color array. The ‘from direction’ and ‘from sequence’ may be sensitive to the data or function which is used for the visualization.
import numpy as np
import matplotlib.pyplot as plt
from mpl_toolkits.mplot3d import axes3d
import s3dlib.surface as s3d
import s3dlib.cmap_utilities as cmu

#.. Alternative xy slice coloration methods

# 1. Define function to examine .....................................

X, Y, Z = axes3d.get_test_data()

# 2. Setup and map surfaces .........................................
rez=6
cX,cY = 'firebrick' , 'forestgreen'
sX,sY = 15,15
cmap = cmu.binary_cmap(cX,cY)
colors = [y for x in [ [cX]*sX , [cY]*sY ] for y in x]

# method 1: direct color assignment for each line ...................
asgn_line = s3d.ParametricLine(rez,color=colors,name="direct assignment")
asgn_line.map_xySlice_from_datagrid(Z,  xset=sX,  yset=sY)

# method 2: composite of two different colored line sets method .....
line1 = s3d.ParametricLine(rez, color=cX)
line1.map_xySlice_from_datagrid( Z, xset=sX )
line2 = s3d.ParametricLine(rez, color=cY)
line2.map_xySlice_from_datagrid( Z, yset=sY )
comp_line = line1 + line2
comp_line.name = "composite"

# method 3: using a binary cmap direction x then y line sets .......
sequ_line = s3d.ParametricLine(rez,cmap=cmap,name="from sequence")
sequ_line.map_xySlice_from_datagrid(Z,  xset=sX,  yset=sY)
sequ_line.map_cmap_from_sequence()

# method 4: using a binary cmap sequential x then y line sets .......
dirc_line = s3d.ParametricLine(rez,cmap=cmap,name="from direction")
dirc_line.map_xySlice_from_datagrid(Z,  xset=sX,  yset=sY)
dirc_line.map_cmap_from_direction([1,0,0])

# 3. Construct figure, add surface, plot ............................
lines = [ asgn_line, comp_line, dirc_line, sequ_line ]

fig = plt.figure(figsize=plt.figaspect(1))
for i,line in enumerate(lines) :
    line.set_linewidth(0.75)
    ax = fig.add_subplot(2,2,i+1, projection='3d', aspect='equal')
    ax.set(xlim=(-1,1), ylim=(-1,1), zlim=(0,1) )
    ax.set(xlim=(-0.8,0.8), ylim=(-0.8,0.8), zlim=(0,0.8) )
    ax.set_axis_off()
    ax.set_title(line.name)
    ax.add_collection3d(line)

fig.tight_layout()
plt.show()