SliceSet Geometry and Color
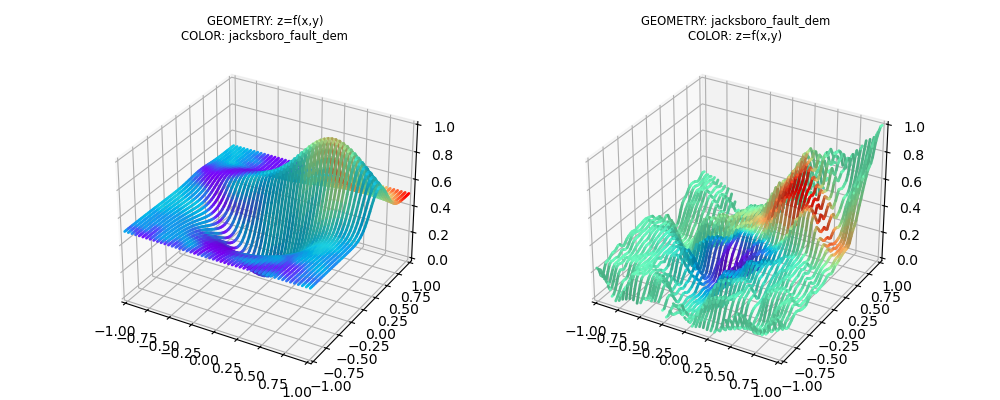
This example demonstrates that two scalars, which are dependent on x and y coordinates, can both be represented as a single 3D surface. One scalar used for geometry and the other scalar used for color.
import numpy as np
import matplotlib.pyplot as plt
from matplotlib import cm
from mpl_toolkits.mplot3d import axes3d
import s3dlib.surface as s3d

#.. SliceSet geom & color from func & datagrid

# 1. Define function to examine .....................................

z=np.load('data/jacksboro_fault_dem.npz')['elevation']
datagrid = np.flip( z[5:50, 5:50], 0 )

def parFunXY(xyz):
    x,y,z = xyz
    X,Y = 3*x, 3*y
    Z1 = np.exp(-(X**2 + Y**2) / 2) / (2 * np.pi)
    Z2 = (np.exp(-(((X - 1) / 1.5)**2 + ((Y - 1) / 0.5)**2) / 2) /
          (2 * np.pi * 0.5 * 1.5))
    Z = Z2 - Z1
    Z = 3*Z + 0.5
    return x,y,Z

def func_Z(xyz) : return parFunXY(xyz)[2]

# 2. Setup and map lines  .........................................
rez, numSlices, lw = 5, 50, 2
cmap = 'rainbow'

line1 = s3d.ParametricLine(rez, name='GEOMETRY: z=f(x,y)', lw=lw )
line1.map_xySlice_from_op(      parFunXY, xset=numSlices)
line1.map_cmap_from_datagrid( datagrid, cmap, cname='COLOR: jacksboro_fault_dem')

line2 = s3d.ParametricLine(rez, name='GEOMETRY: jacksboro_fault_dem', lw=lw)
line2.map_xySlice_from_datagrid(datagrid, xset=numSlices)
line2.map_cmap_from_op(       func_Z,   cmap, cname='COLOR: z=f(x,y)'  )

# 3. Construct figure, add surface, plot ............................

lines = [ line1, line2 ]

fig = plt.figure(figsize=(10,4))
for i,line in enumerate(lines) :
    ax = fig.add_subplot(121+i, projection='3d')
    ax.set(xlim=(-1,1), ylim=(-1,1), zlim=(0,1) )
    title = line.name + '\n' + line.cname
    ax.set_title(title, fontsize='small')

    ax.add_collection3d(line.shade(0.5))

fig.tight_layout()
plt.show()
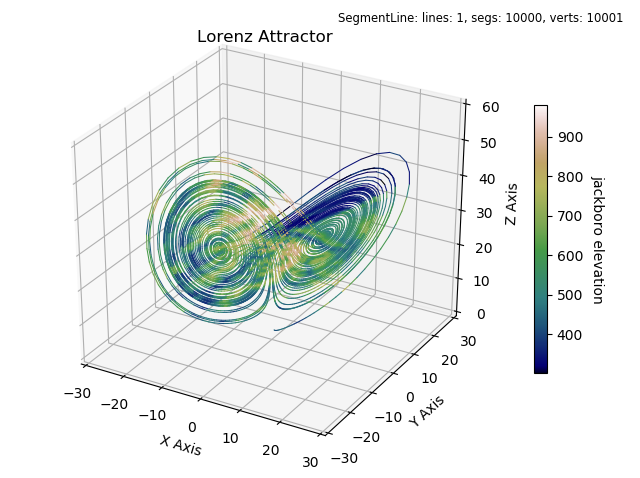
The above plot uses a ParametricLine object, however this may be applied to any line object. For example, the following figure uses the Lorenz Attractor segmented line with coloring from the datagrid.