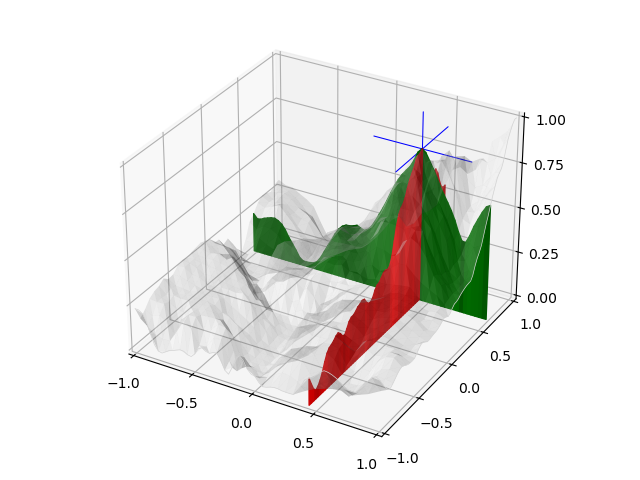
Datagrid XY Filled Slices

This is created using modifications from Datagrid XY Slices script as:
filled surface is constructed from the lines.
outline only is shown for the facing surface edges.
the filled surfaces are added to the axis
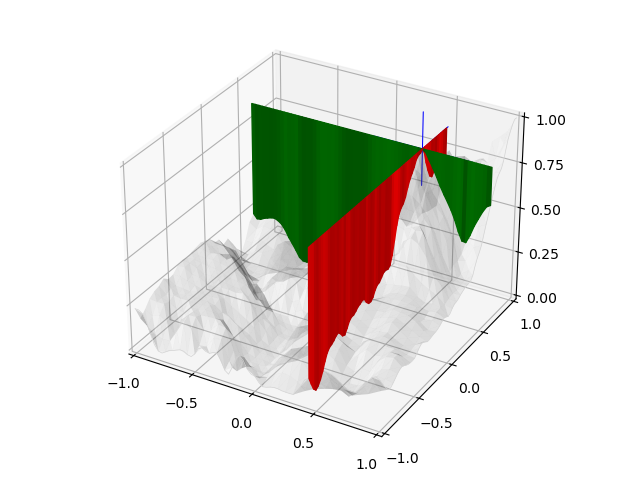
The filled surface z-axis boundary may be placed at an alternative position using the get_filled_surface method argument. For example, replacing highlighted line by:
line_surf = line.get_filled_surface(dist=0.848)
produces the following plot.

Since the surface color is taken from the ‘shaded’ line, the surface has a banded texture in these figures.
import numpy as np
import matplotlib.pyplot as plt
from matplotlib.ticker import LinearLocator
import s3dlib.surface as s3d

#.. Datagrid sliced coordinate line filled plot

# 1. Define function to examine .....................................
z=np.load('data/jacksboro_fault_dem.npz')['elevation']
datagrid = np.flip( z[5:50, 5:50], 0 )

# 2. Setup and map surfaces .........................................
rez=5
ls = s3d.elev_azim_2vector(0,-135)

line = s3d.ParametricLine(rez,lw=3, color=['r','g'])
line.map_xySlice_from_datagrid(datagrid, xplane=0.441,yplane=0.624).shade(0.5,ls)
line_surf = line.get_filled_surface()                                 #.... 1
line_surf = line.get_filled_surface(dist=0.848)

crosshair = s3d.ParametricLine(0,lw=0.75, color='b')
crosshair.transform(scale=(.4,.4,.2),translate=[0.441,0.624,0.848])

outline = s3d.ParametricLine(rez,lw=.5, color='lightgrey')
outline.map_xySlice_from_datagrid(datagrid, xplane=1.0, yplane=-1.0)  #.... 2

surface = s3d.PlanarSurface(4, basetype='oct1', color='w',lw=0)
surface.map_geom_from_datagrid( datagrid ).shade(direction=ls).set_surface_alpha(0.2)

# 3. Construct figure, add surface, plot ............................
fig = plt.figure()
ax = plt.axes(projection='3d')
ax.set(xlim=(-1,1), ylim=(-1,1), zlim=(0,1) )
ax.xaxis.set_major_locator(LinearLocator(5))
ax.yaxis.set_major_locator(LinearLocator(5))
ax.zaxis.set_major_locator(LinearLocator(5))

ax.add_collection3d(line_surf)                                       #.... 3
ax.add_collection3d(crosshair)
ax.add_collection3d(surface)
ax.add_collection3d(outline)

fig.tight_layout()
plt.show()
