Elliptic Curve

An elliptic curve is a plane curve which satisfies the solutions (x,y) for:
y2 = x3 + ax + b
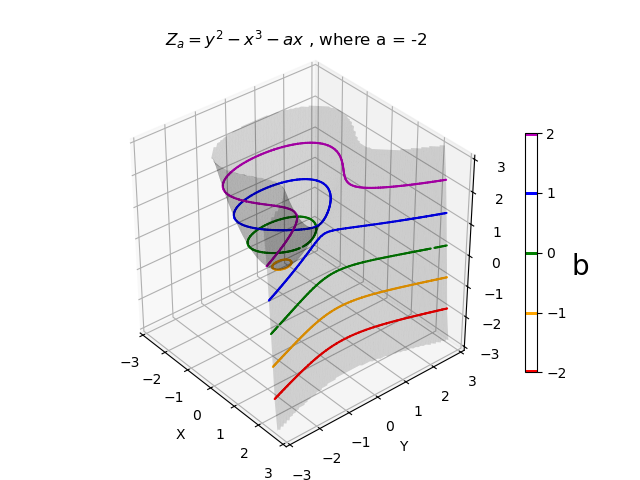
for some coefficients a and b. By rearranging the above, b can be expressed as a function of x and y with a as a coefficient. Considering b as an independent variable, Za with a as a coefficient, a surface is defined using:
za(x,y) = y2 - x3 - ax
For any given value of the coefficients a, constant Z-contours on the Za surface represent the elliptic curve for constant a and b. The above plot shows a surface for a=-2, with elliptic curves for various values of b.
import numpy as np
from matplotlib import pyplot as plt
import s3dlib.surface as s3d
import s3dlib.cmap_utilities as cmu

#.. Elliptic Curves_b

# 1. Define function to examine .....................................
maxZ = 3
rez, dmn = 6, (-3,3)
fiveCmap = cmu.stitch_color('r','orange','g','b','m')
tks = [-2,-1,0,1,2]

def eSurface_A(xyz,a) :
    x,y,z = xyz
    Z = y**2 - x**3 - a*x
    Z = np.where(np.abs(Z) > maxZ, maxZ*np.sign(Z), Z )
    return x,y,Z

# 2. Setup and map surfaces .........................................
a,b = -2, tks          #...... coefficients
title = r"$Z_{a} = y^{2} - x^{3} - ax$ , where a = -2"

surface = s3d.PlanarSurface(rez,color='k').domain(dmn,dmn)

surface.map_geom_from_op( lambda xyz : eSurface_A(xyz,a) )
surface.clip( lambda c : np.abs(c[2]) < maxZ )
surface.shade().set_surface_alpha(.15)

contours = surface.contourLines(*b)
contours.map_cmap_from_op( lambda xyz: xyz[2],fiveCmap,cname='b')

# 3. Construct figure, add surface, plot ............................
fig = plt.figure(figsize=plt.figaspect(0.75))
ax = plt.axes(projection='3d', aspect='equal')
ax.set_title(title, fontsize='large')
ax.set( xlabel='X', ylabel='Y', xlim=dmn,ylim=dmn,zlim=dmn)
cbar = plt.colorbar(contours.stcBar_ScalarMappable(5, bgcolor='w'), ax=ax,  shrink=0.6 )
cbar.set_label(contours.cname, rotation=0, labelpad = 10, fontsize=20)
cbar.set_ticks(ticks=tks)
ax.view_init(35,-40)

ax.add_collection3d(surface)
ax.add_collection3d(contours)

fig.tight_layout(pad=2)
plt.show()
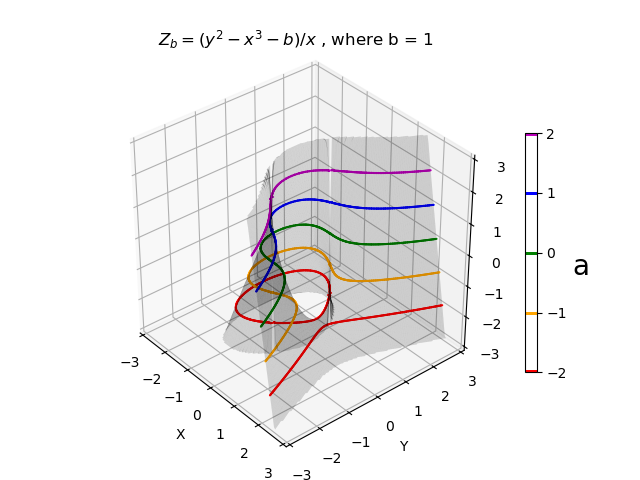
Alternatively rearranging the first equation, a can be expressed as a function of x and y with b as a coefficient. Now using a as an independent variable, Zb with b as a coefficient, a surface is defined using:
zb(x,y) = ( y2 - x3 - b )/ x
For any given value of the coefficients b, constant Z-contours on the Zb surface represent the elliptic curve for constant a and b. The following plot shows a surface for b=1, with elliptic curves for various values of a.

Since the Zb function for the constant b surface goes to infinity as x goes to zero, two surfaces are used which exclude x at zero. This is shown in the highlighted code below.
def eSurface_B(xyz,b) :
    x,y,z = xyz
    Z = (y**2 - x**3 - b)/x
    Z = np.where(np.abs(Z) > maxZ, maxZ*np.sign(Z), Z )
    return x,y,Z

# 2. Setup and map surfaces .........................................
a,b = tks, 1          #...... coefficients
title = r"$Z_{b} = (y^{2} - x^{3} - b )/x$ , where b = 1"

surface1 = s3d.PlanarSurface(rez,color='k').domain( (-3,-0.0001) ,dmn)
surface2 = s3d.PlanarSurface(rez,color='k').domain( ( 0.0001, 3) ,dmn)
surface = surface1 + surface2

surface.map_geom_from_op( lambda xyz : eSurface_B(xyz,b) )
surface.clip( lambda c : np.abs(c[2]) < maxZ )
surface.shade().set_surface_alpha(.15)

contours = surface.contourLines(*a)
contours.map_cmap_from_op( lambda xyz: xyz[2],fiveCmap,cname='a')
