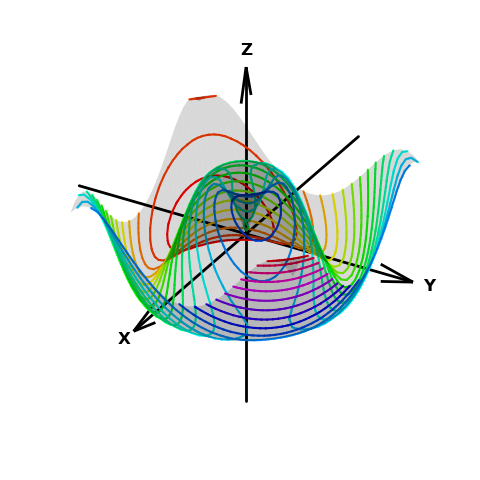
Colored Surface Contour Set

In this example, contour planes are defined by direction plane normals. Color mapping of the contour lines are also along the same direction using the directionDist function. Alternative direction color mapping may be applied, as shown in the General Surface Contour Projections example.
import numpy as np
import matplotlib.pyplot as plt
import s3dlib.surface as s3d

# 1. Define functions to examine ....................................
direction = [1,1,1]

def wavefunc(xyz) :
    x,y,z = xyz
    r = np.sqrt( x**2 + y**2)
    Z = np.sin( 6.0*r )/2
    return x,y,Z

def directionDist(xyz) :
    xyzT = np.array(xyz).T
    return np.dot(xyzT,direction)

# 2. Setup and map surfaces .........................................
rez = 5

surface = s3d.PlanarSurface(rez,color='k',lw=0)
surface.map_geom_from_op( wavefunc ).set_surface_alpha(.15)

line = surface.contourLineSet(25,direction=direction)
line.map_cmap_from_op(directionDist,'hsv')

# 3. Construct figure, add surfaces, and plot ......................

fig = plt.figure(figsize=plt.figaspect(1))
ax = plt.axes(projection='3d', aspect='equal')
minmax = (-1,1)
ax.set(xlim=minmax, ylim=minmax, zlim=minmax)
s3d.standardAxis( ax,length=[1.75,1.5,1.5],negaxis=True )

ax.add_collection3d(surface)
ax.add_collection3d(line)

fig.tight_layout()
plt.show()
