import matplotlib.pyplot as plt
import s3dlib.surface as s3d
import numpy as np
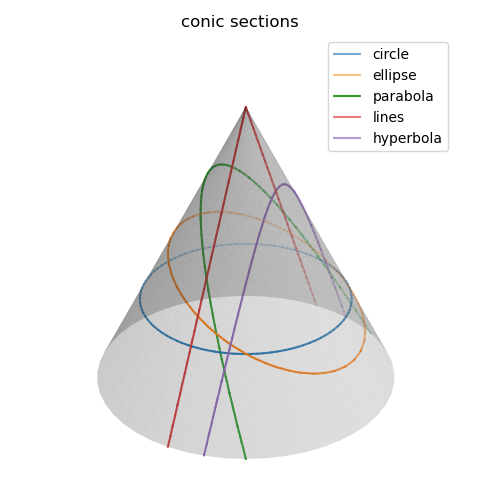
#.. Conic Sections
# 1. Define function to examine .....................................
def cone(rtz) :
r,t,z = rtz
R = 0.5*(1.00001-z)
return R,t,z
# 2. Setup and map surfaces .........................................
rez=4
surface = s3d.CylindricalSurface(rez,color='grey',lw=0.0).map_geom_from_op(cone)
circle = surface.contourLines( -0.4, direction=[0,0,1], name='circle', color='C0', coor='p' )
ellipse = surface.contourLines( -0.2, direction=[0.5,0,1], name='ellipse', color='C1', coor='p' )
parabola = surface.contourLines( 0, direction=[1,0,.5], name='parabola', color='C2', coor='p' )
X = surface.contourLines( 0, direction=[1,0,0], name='lines', color='C3', coor='p' )
hyperbola = surface.contourLines( 0.25, direction=[1,0,0], name='hyperbola', color='C4', coor='p' )
surface.shade().set_surface_alpha(.25)
# 3. Construct figure, add surface, plot ............................
fval = 0.2
fig = plt.figure(figsize=plt.figaspect(1))
ax = plt.axes(projection='3d', aspect='equal')
minmax = (-0.8,0.8)
ax.set(xlim=minmax, ylim=minmax, zlim=minmax)
ax.set_title('conic sections')
ax.set_axis_off()
ax.add_collection3d(circle.fade(fval))
ax.add_collection3d(ellipse.fade(fval))
ax.add_collection3d(parabola.fade(fval))
ax.add_collection3d(X.fade(fval))
ax.add_collection3d(hyperbola.fade(fval))
ax.legend()
ax.add_collection3d(surface)
fig.tight_layout()
plt.show()