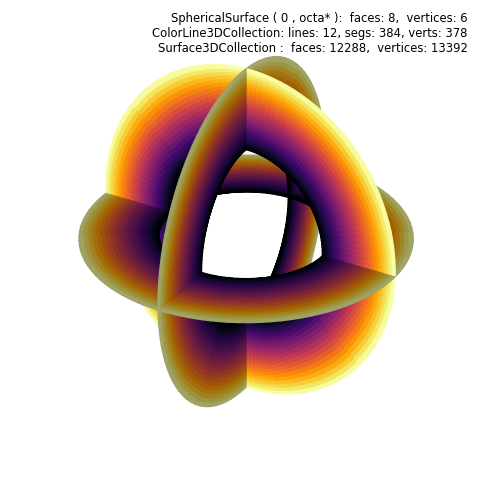
Spherical Edge Filled Surface

Similar to the sequence of stacking toy blocks, S3Dllib visualizations are ‘similar but different’ depending on which methods and sequences the objects are constructed. Construction of filled line examples included:
contour lines filled to a spherical plane. Spherical Contour Filled Surface.
surface edges filled to edges, Edge to Edge Surface.
surface edges filled to a spherical plane, as in this example.
In this case, two filled surfaces are combined, one produced from an inner projected sphere, the other from an outer projected sphere. The single composite surface is then colormapped along the radial direction.
import numpy as np
import matplotlib.pyplot as plt
import s3dlib.surface as s3d

# Spherical Edge Filled Surface

# 2. Setup and map surfaces .........................................
rez,lrez,srez = 0 ,4,5

surface = s3d.SphericalSurface.platonic(rez,'octa')
line = surface.edges
line.shred(srez)

fsurf1 = line.get_filled_surface(dist=0.65,coor='s',lrez=lrez)
fsurf2 = line.get_filled_surface(dist=1.25,coor='s',lrez=lrez)
fsurf = fsurf1+fsurf2

fsurf.map_cmap_from_op( lambda c : s3d.SphericalSurface.coor_convert(c)[0],'inferno')

# 3. Construct figure, add surface, plot ............................

fig = plt.figure(figsize=plt.figaspect(1))
fig.text(0.975,0.975, str(surface)+'\n'+str(line)+'\n'+str(fsurf),
    ha='right', va='top', fontsize='smaller', multialignment='right')
ax = plt.axes(projection='3d', aspect='equal')
s3d.auto_scale(ax,fsurf,uscale=0.7)
ax.set_axis_off()

ax.add_collection(fsurf.shade(0.5,isAbs=True))

fig.tight_layout()
plt.show()
