
Functional Line Color
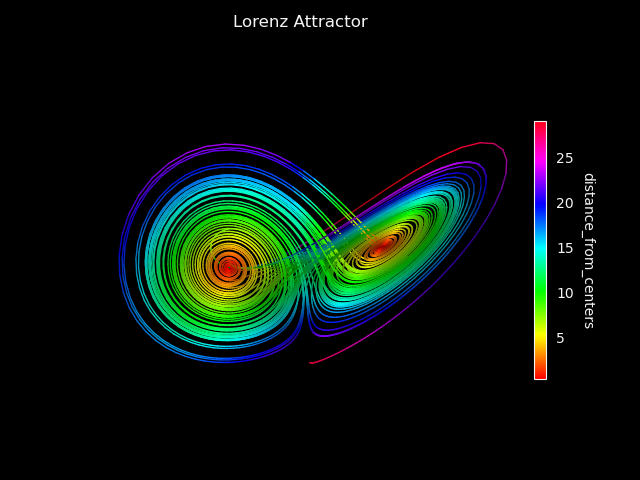
The colormapping of each segment is based on the segments center distance to the nearest lobe center ( using the function distance_from_centers )
import numpy as np
import matplotlib.pyplot as plt
import s3dlib.surface as s3d
import s3dlib.cmap_utilities as cmu

#.. Lorenz value position

# 1. Define function to examine .....................................

# +----------------------------------------------------------------------------
# |  The following code between the ========= comments was copied DIRECTLY from
# |  https://matplotlib.org/stable/gallery/mplot3d/lorenz_attractor.html#sphx-glr-gallery-mplot3d-lorenz-attractor-py
# |
# +----------------------------------------------------------------------------
# ===================================================== start of copy.

def lorenz(x, y, z, s=10, r=28, b=2.667):
    """
    Given:
       x, y, z: a point of interest in three dimensional space
       s, r, b: parameters defining the lorenz attractor
    Returns:
       x_dot, y_dot, z_dot: values of the lorenz attractor's partial
           derivatives at the point x, y, z
    """
    x_dot = s*(y - x)
    y_dot = r*x - y - x*z
    z_dot = x*y - b*z
    return x_dot, y_dot, z_dot

dt = 0.01
num_steps = 10000

# Need one more for the initial values
xs = np.empty(num_steps + 1)
ys = np.empty(num_steps + 1)
zs = np.empty(num_steps + 1)

# Set initial values
xs[0], ys[0], zs[0] = (0., 1., 1.05)

# Step through "time", calculating the partial derivatives at the current point
# and using them to estimate the next point
for i in range(num_steps):
    x_dot, y_dot, z_dot = lorenz(xs[i], ys[i], zs[i])
    xs[i + 1] = xs[i] + (x_dot * dt)
    ys[i + 1] = ys[i] + (y_dot * dt)
    zs[i + 1] = zs[i] + (z_dot * dt)

# ===================================================== end of copy.
lineCoor = np.array( [xs,ys,zs] ).T

cent_A = np.asarray( [  8.5,  8.5, 27.0 ] )
cent_B = np.asarray( [ -8.5, -8.5, 27.0 ] )

def distance_from_centers(xyz) :
    dist_A = np.subtract(xyz.T, cent_A )
    dist_A = np.linalg.norm(dist_A,axis=1)
    dist_B = np.subtract(xyz.T, cent_B )
    dist_B = np.linalg.norm(dist_B,axis=1)
    dist = np.where( dist_A < dist_B , dist_A, dist_B)
    return dist

# 2. Setup and map surfaces .........................................

line = s3d.SegmentLine( lineCoor, "Lorenz Attractor", lw=1.0 )
line.map_cmap_from_op(distance_from_centers,'hsv')

# 3. Construct figure, add surface, plot ............................

acolor = 'whitesmoke'
fig = plt.figure(facecolor='k')
ax = plt.axes(projection='3d',facecolor='k')
ax.set(xlim=(-20,20), ylim=(-20,20), zlim=(10,50) )
ax.set_title( line.name, color=acolor )
ax.set_axis_off()
cbar = plt.colorbar(line.cBar_ScalarMappable, ax=ax,  shrink=0.6, pad=.03 )
cbar.set_label(line.cname, rotation=270, labelpad = 15, color=acolor)
cbar.outline.set_edgecolor(acolor)
plt.setp(plt.getp(cbar.ax.axes, 'yticklabels'), color=acolor)

ax.add_collection3d(line.shade(0.5))

fig.tight_layout()
plt.show()