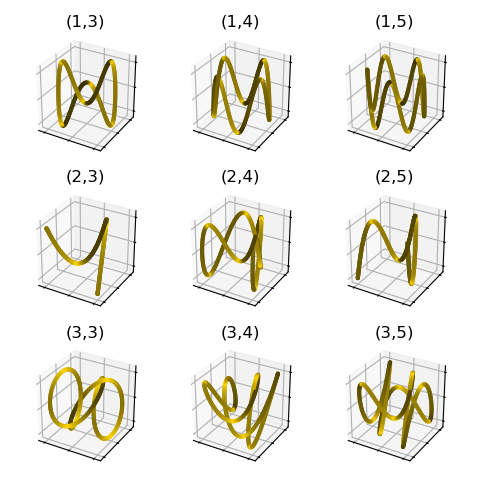
import numpy as np
from matplotlib import pyplot as plt
import s3dlib.surface as s3d
import s3dlib.cmap_utilities as cmu

#.. Parameteric Line Set

# 1. Define function to examine .....................................

def generalizedFunc(t, ny, nz) :
    t = 2*np.pi*t
    x, y, z = np.sin(t), np.cos(ny*t), np.sin(nz*t)
    return x,y,z

# 2 & 3. Setup lines and plot ......................................
rez = 7
minmax = (-1.2,1.2)
fig2 = plt.figure(figsize=plt.figaspect(1))
n=0
for ny in range(1,4) :
    for nz in range(3,6) :
        n += 1
        ax = fig2.add_subplot(3,3,n, projection='3d',aspect='equal')
        ax.set(xlim=minmax, ylim=minmax, zlim=minmax )
        line = s3d.ParametricLine(rez,
            lambda t : generalizedFunc(t,ny,nz), color='gold',lw=3 )
        ax.set_title('('+str(ny)+','+str(nz)+')' , fontsize='large')
        ax.add_collection3d(line.shade(.2))
        ax.tick_params(labelcolor='w')

fig2.tight_layout()

# ==================================================================

plt.show()

