
Multiple Object Operations
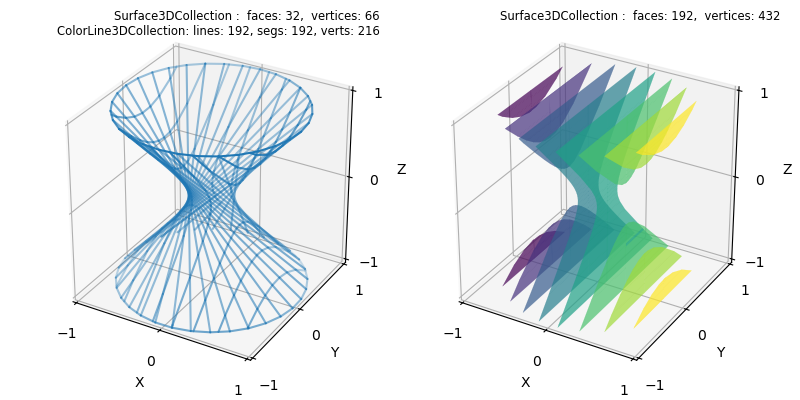
This example demonstrates the utility of using an OOPs approach to constructing surface visualizations. In this case, the final surface is the result of a sequence of operations in which line and surface objects are used to construct line and surface objects.
import numpy as np
from matplotlib import pyplot as plt
import s3dlib.surface as s3d
import copy

#.. Muliple line/surface operations for surface construction, II.

# 1. Define functions to examine ....................................

def circle(t,r,z,twist) :
    theta = (2*t+twist)*np.pi
    x = r*np.cos(theta)
    y = r*np.sin(theta)
    z = z*np.ones(len(t))
    return x,y,z

radius, twist = 1, 0.85
top_circle = lambda t: circle(t,radius,1,0.0)
btm_circle = lambda t: circle(t,radius,-1.0,twist)

# 2. Setup and map surfaces .........................................
rez=4

# 1. lines: top and bottom circles
line_1 = s3d.ParametricLine(rez,top_circle)
line_2 = s3d.ParametricLine(rez,btm_circle)

# 2. surface: hyperboloid surface from lines
surface = line_1.get_surface_to_line(line_2)

# 3. lines: upper & lower contours from hyperboloid surface
conLines = surface.contourLineSet(8,direction=[1,0,0])

# 4. surface: filled surface from contour lines
conSurf = conLines.get_filled_surface(dist= 0, coor='y')

conSurf.map_cmap_from_op( lambda c : c[0] )
conSurf.set_surface_alpha(0.7)

# 3. Construct figure, add surfaces, and plot ......................

minmax,ticks=(-1,1), [-1,0,1]
fig = plt.figure(figsize=(8,4))
label = [ str(surface) +'\n' + str(conLines) , str(conSurf) ]

for i in range(2):
    fig.text(0.5*i+0.475,0.975,label[i], ha='right', va='top', fontsize='smaller', multialignment='right')
    ax= fig.add_subplot(121+i, projection='3d', aspect='equal')
    ax.set(xlim=minmax, ylim=minmax, zlim=minmax,
            xlabel='X', ylabel='Y', zlabel='Z',
            xticks=ticks, yticks=ticks, zticks=ticks
        )
    if i==0 :
        ax.add_collection3d(surface.edges.fade())
        ax.add_collection3d(conLines.fade())
    else:
        ax.add_collection3d(conSurf)
fig.tight_layout(pad=2)
plt.show()
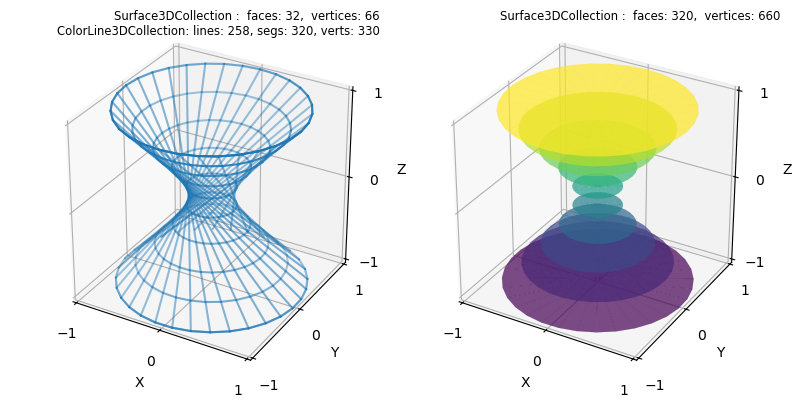
The following figure is a similar construction for xy planes compared to the above figure. However for this case, xy planar lines at the top and bottom of the hyperboloid were added to the set of contours, as shown in the highlighted line in the script. This was needed since the contourLineSet method constructs contours within the bounds of the surface but does not include contours at the bounds.
import numpy as np
from matplotlib import pyplot as plt
import s3dlib.surface as s3d

#.. Muliple line/surface operations for surface construction, I.

# 1. Define functions to examine ....................................

def circle(t,r,z,twist) :
    theta = (2*t+twist)*np.pi
    x = r*np.cos(theta)
    y = r*np.sin(theta)
    z = z*np.ones(len(t))
    return x,y,z

radius, twist = 1, 0.85
top_circle = lambda t: circle(t,radius,1,0.0)
btm_circle = lambda t: circle(t,radius,-1.0,twist)

# 2. Setup and map surfaces .........................................
rez=4

# 1. lines: top and bottom circles
line_1 = s3d.ParametricLine(rez,top_circle)
line_2 = s3d.ParametricLine(rez,btm_circle)

# 2. surface: hyperboloid surface from lines
surface = line_1.get_surface_to_line(line_2)

# 3. lines: contours from hyperboloid surface
conLines = surface.contourLineSet(8) + line_1 + line_2

# 4. surface: filled surface from contour lines
conSurf = conLines.get_filled_surface(dist=0.01,coor='c')

conSurf.map_cmap_from_op( lambda c : c[2] )
conSurf.set_surface_alpha(0.7)

# 3. Construct figure, add surfaces, and plot ......................

minmax,ticks=(-1,1), [-1,0,1]
fig = plt.figure(figsize=(8,4))
label = [ str(surface) +'\n' + str(conLines) , str(conSurf) ]

for i in range(2):
    fig.text(0.5*i+0.475,0.975,label[i], ha='right', va='top', fontsize='smaller', multialignment='right')
    ax= fig.add_subplot(121+i, projection='3d', aspect='equal')
    ax.set(xlim=minmax, ylim=minmax, zlim=minmax,
            xlabel='X', ylabel='Y', zlabel='Z',
            xticks=ticks, yticks=ticks, zticks=ticks
        )
    if i==0 :
        ax.add_collection3d(surface.edges.fade())
        ax.add_collection3d(conLines.fade())
    else:
        ax.add_collection3d(conSurf)
fig.tight_layout(pad=2)
plt.show()