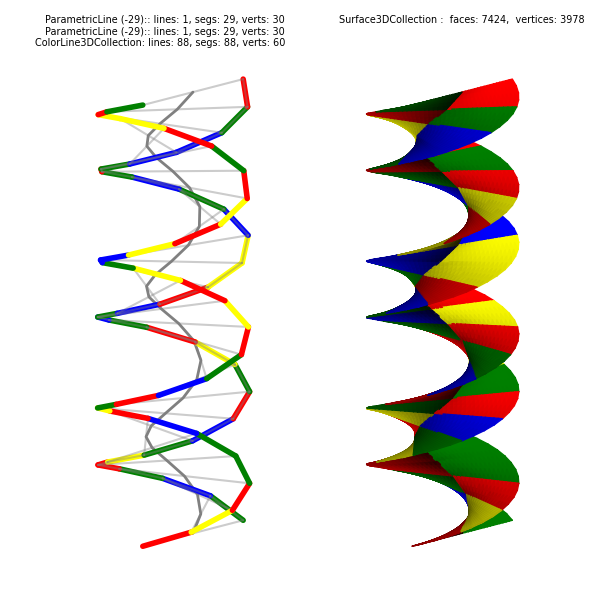
Double Helix from Lines

This example constructs surfaces with colors along specific sections by using colored segmented lines. A middle line is used to provide different colors between ‘visually’ the same plane between line projections. Increase in the number of surface faces is accomplished using line shredding and use of lrez during surface construction, as described in the Surface Subdivision for 3D Color Rendering, lrez documentation.
An alternative method of creating the helical surface using a CylindricalSurface is given in the Angular 4-Color Color Map example.
import copy
import numpy as np
from matplotlib import pyplot as plt
import s3dlib.surface as s3d

#.. Double Helix Surface from helix lines.

# 1. Define functions to examine ....................................
code = "AGATTCAGTACTAGAGTCCGAGATAGGAT"
k = 3                 # number of twists
p1, p2 = 13.0, 21.0   # double helix spacing
#hw, hl = 20.0        # helix width
#bppt = 10.5          # base pairs per twist
delta = np.pi*p1/(p1+p2)

def baseColor(codeString, isIn=False) :
    colors =  ['red','yellow','green','blue']
    codeInx = { 'A':0, 'G':1, 'T':2, 'C':3 }
    posMap = []
    for code in codeString :
        indx = codeInx[code] if isIn else (codeInx[code]+2)%4
        posMap.append( colors[indx] )
    return np.array(posMap)

def helix(t,isPos) :
    ofset = delta if isPos else -delta
    r = np.ones(len(t))
    T = 2*k*t*np.pi + ofset
    z = 2*t - 1
    return s3d.CylindricalSurface.coor_convert([r,T,7*z],True)

top_helix = lambda t: helix(t,True)
btm_helix = lambda t: helix(t,False)
mid_helix = lambda t: ( np.array(top_helix(t)) + np.array(btm_helix(t)) )/2.0

def unitRadius(xyz) :
    r,t,z = s3d.CylindricalSurface.coor_convert(xyz,False)
    return s3d.CylindricalSurface.coor_convert([np.ones(len(r)),t,z],True)

# 2. Setup and map surfaces .........................................
rez, lrez, shrez = -len(code), 4, 2

line_1 = s3d.ParametricLine(rez,top_helix,lw=4)
line_2 = s3d.ParametricLine(rez,btm_helix,lw=4)
line_3 = s3d.ParametricLine(rez,mid_helix,color='grey',lw=2)

edges = line_1.get_surface_to_line(line_2).edges
edges.set_color([.5,.5,.5,0.4])

line_1.shred(0).set_color( baseColor(code,False) )
line_2.shred(0).set_color( baseColor(code,True) )

line_1r = copy.copy(line_1).shred(shrez).map_geom_from_op(unitRadius)
line_2r = copy.copy(line_2).shred(shrez).map_geom_from_op(unitRadius)
line_3r = copy.copy(line_3).shred(shrez)

surface1 = line_1r.get_surface_to_line(line_3r,lrez=lrez) # surface takes line_1 color.
surface2 = line_2r.get_surface_to_line(line_3r,lrez=lrez) # surface takes line_2 color.
surface = surface1 + surface2
surface.evert().triangulate()

# 3. Construct figure, add surfaces, and plot ......................

#.. following is to position the objects in the single view axes.
ofsXY,ofsZ = 1.25, -.5
edges.transform(translate=[-ofsXY,-ofsXY,ofsZ])
line_1.transform(translate=[-ofsXY,-ofsXY,ofsZ])
line_2.transform(translate=[-ofsXY,-ofsXY,ofsZ])
line_3.transform(translate=[-ofsXY,-ofsXY,ofsZ])
surface.transform(translate=[ofsXY,ofsXY,ofsZ])

minmaxZ, minmax = (-5.25,5.25), (-2.25,2.25)
fig = plt.figure(figsize=(6,6))
label = [ str(line_1) +'\n' + str(line_2) +'\n' + str(edges), str(surface) ]
fig.text(0.475,0.975,label[0], ha='right', va='top', color='k',fontsize='x-small', multialignment='right')
fig.text(0.5+0.475,0.975,label[1], ha='right', va='top', color='k',fontsize='x-small', multialignment='right')
ax = plt.axes(projection='3d',aspect='equal')
ax.set_proj_type('ortho')
ax.set(xlim=minmax, ylim=minmax, zlim=minmaxZ)
ax.set_axis_off()
ax.view_init(15,-45)

ax.add_collection3d(edges)
ax.add_collection3d(line_1)
ax.add_collection3d(line_2)
ax.add_collection3d(line_3)
ax.add_collection3d(surface.shade())

fig.tight_layout(pad=0)
plt.show()
