
Line Sequence Dependent Surfaces
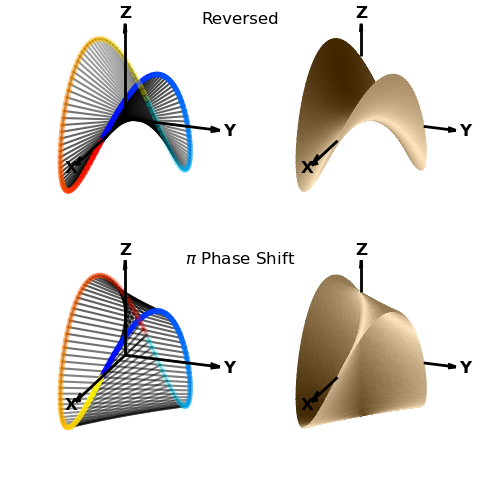
Using the line method get_surface_to_line, a surface is generated from line to line in sequential order of the lines. This example demonstrates the effect of line sequence on the resulting surface. In the above figure, the two lines are shown using different sequential colormaps. The resulting surfaces are seen dependent on the sequential order of the ‘red to yellow’ line.
import numpy as np
from matplotlib import pyplot as plt
import s3dlib.surface as s3d
import s3dlib.cmap_utilities as cmu

#.. Conoid surface from Lines

# 1. Define functions to examine ....................................

def conoid_edge(t,isTop,isRev) :
    theta = np.pi*t
    if not isTop :
        if isRev: theta = -theta    # reversed
        else :    theta += np.pi    # pi phase shift
    x = np.cos(theta)
    y = np.sin(theta)
    z = np.sin(2*theta)
    return x,y,z

# 3. Construct figure, surfaces, and plot ..........................
rez=5
b2c = cmu.hsv_cmap_gradient('blue','cyan')
r2y = cmu.hsv_cmap_gradient('red','yellow')
cmu.rgb_cmap_gradient([0.25,0.15,0],[1,.9,.75],'cardboard')

minmax=(-1,1)
fig = plt.figure(figsize=plt.figaspect(1))

for j in range(2) :
    top_conoid = lambda t : conoid_edge(t,True , j==0)
    btm_conoid = lambda t : conoid_edge(t,False, j==0)
    line_1 = s3d.ParametricLine(rez,top_conoid).map_cmap_from_sequence(b2c)
    line_2 = s3d.ParametricLine(rez,btm_conoid).map_cmap_from_sequence(r2y)
    lines = line_1 + line_2
    lines.set_linewidth(4)
    edges = line_1.get_surface_to_line(line_2).edges
    edges.set_color('k')
    surface = line_1.get_surface_to_line(line_2,lrez=5).triangulate()
    surface.map_cmap_from_normals(cmap='cardboard', direction=[1,1,1],isAbs=True)
    info = 'Reversed' if j==0 else r'$\pi$ Phase Shift'
    fig.text(0.5,0.95-0.5*j,info,ha='center',fontsize='large')
    for i in range(2):
        k = 2*j + i
        ax= fig.add_subplot(221+k, projection='3d', aspect='equal')
        ax.set(xlim=minmax, ylim=minmax, zlim=minmax )
        ax.view_init(20,20)
        if i==0 :
            ax.add_collection3d(edges.fade(0.2,ax=ax))
            ax.add_collection3d(lines.fade(0.2,ax=ax))
        else:
            ax.add_collection3d(surface)
        offset = 1.0 if i==1 else 0.0
        alr = 0.25 if i==1 else 0.1
        s3d.setupAxis(ax,length=[2,1.5,1.5],offset=offset, alr=alr)
        ax.set_axis_off()

fig.tight_layout(pad=0.5)
plt.show()