Mobius From Lines

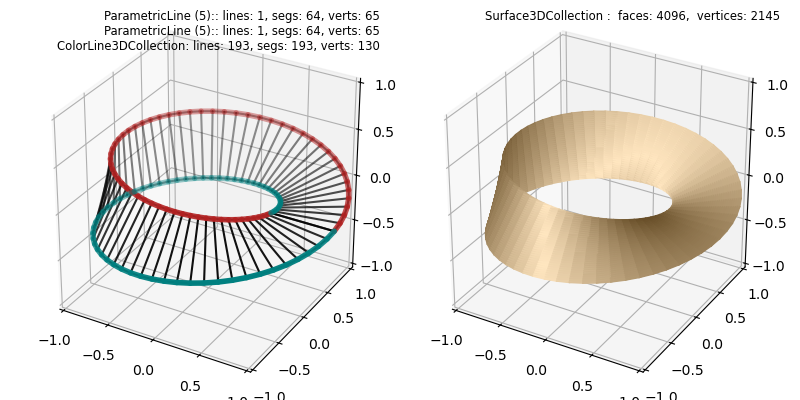
The Cylindrical Coordinates example surface was constructed by mapping a base CylindricalSurface object. Alternatively, a similar surface may be constructed using the line method get_surface_to_line from a set of twisted lines. The function for the lines is a slight modification, highlighted below, of the surface example function. This function defines only the edges of the mobius strip.
import numpy as np
from matplotlib import pyplot as plt
import s3dlib.surface as s3d
import s3dlib.cmap_utilities as cmu

#.. Mobius surface from Lines

# 1. Define functions to examine ....................................

def mobius_edge(t,isTop,twists) :
    T = 2*np.pi*t
    thickness = 0.33
    w = thickness if isTop else -thickness
    phi = 0.5*T*twists
    R = 1 + w * np.cos(phi)
    x = R*np.cos(T)
    y = R*np.sin(T)
    z = w * np.sin(phi)
    return x,y,z

twists = 1
top_mobius = lambda t : mobius_edge(t,True,twists)
btm_mobius = lambda t : mobius_edge(t,False,twists)

# 2. Setup and map surfaces .........................................
rez=5
cmu.rgb_cmap_gradient([0.25,0.15,0],[1,.9,.75],'cardboard')

line_1 = s3d.ParametricLine(rez,top_mobius,color='firebrick')
line_2 = s3d.ParametricLine(rez,btm_mobius,color='teal')
lines = line_1 + line_2
lines.set_linewidth(4)

edges = line_1.get_surface_to_line(line_2).edges # create temp surface for 'simple' edges.
edges.set_color('k')

surface = line_1.get_surface_to_line(line_2,lrez=5).triangulate()
surface.map_cmap_from_normals(cmap='cardboard', direction=[1,1,1],isAbs=True)

# 3. Construct figure, add surfaces, and plot ......................

minmax,ticks=(-1,1), [-1,-.5,0,0.5,1]
fig = plt.figure(figsize=(8,4))
label = [ str(line_1) +'\n' + str(line_2) +'\n' + str(edges) , str(surface) ]

for i in range(2):
    fig.text(0.5*i+0.475,0.975,label[i], ha='right', va='top', fontsize='smaller', multialignment='right')
    ax= fig.add_subplot(121+i, projection='3d', aspect='equal')
    ax.set(xlim=minmax, ylim=minmax, zlim=minmax,
            xticks=ticks, yticks=ticks, zticks=ticks
        )
    if i==0 :
        ax.add_collection3d(edges.fade(.4))
        ax.add_collection3d(lines.fade(.4))
    else:
        ax.add_collection3d(surface)

fig.tight_layout()
plt.show()
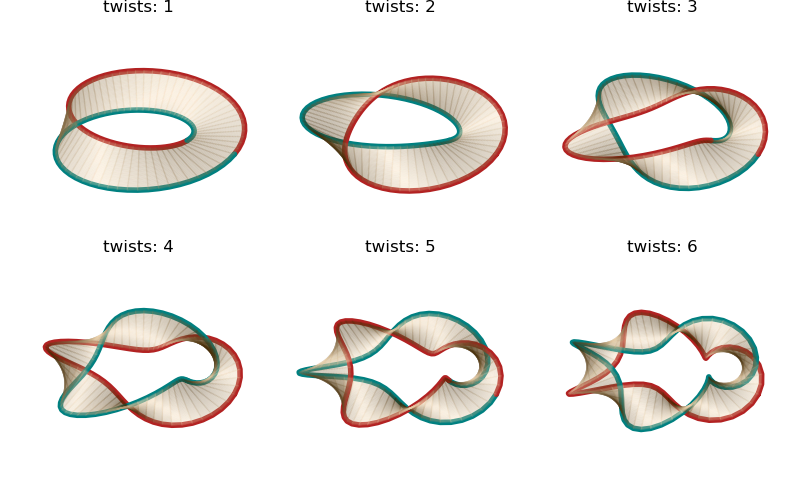
As with the surface example, the various twisted surfaces were constructed from the line method, as shown below.

The inclusion of the colored line surface edges enhances the distinction between orientable surfaces (even twists) and non-orientable surfaces (odd twists).
# 2 & 3. Setup surfaces and plot ....................................
rez, alp = 5, 0.1
cmu.rgb_cmap_gradient([0.25,0.15,0,alp],[1,.9,.75,alp],'cardboard')

fig = plt.figure(figsize=plt.figaspect(0.6))
minmax = (-.87,.87)
for i in range(1,7) :
    ax = fig.add_subplot(2,3,i, projection='3d')
    ax.set(xlim=minmax, ylim=minmax, zlim=minmax )
    line_1 = s3d.ParametricLine(rez,lambda t : mobius_edge(t,True,i), color='firebrick', lw=4 )
    line_2 = s3d.ParametricLine(rez,lambda t : mobius_edge(t,False,i), color='teal', lw=4)
    surface = line_1.get_surface_to_line(line_2,lrez=5).triangulate()
    surface.map_cmap_from_normals(cmap='cardboard', direction=[1,1,1], isAbs=True)
    ax.set_title('twists: '+str(i))
    ax.add_collection3d(line_1)
    ax.add_collection3d(line_2)
    ax.add_collection3d(surface)
    ax.set_axis_off()

fig.tight_layout(pad=0)
plt.show()
