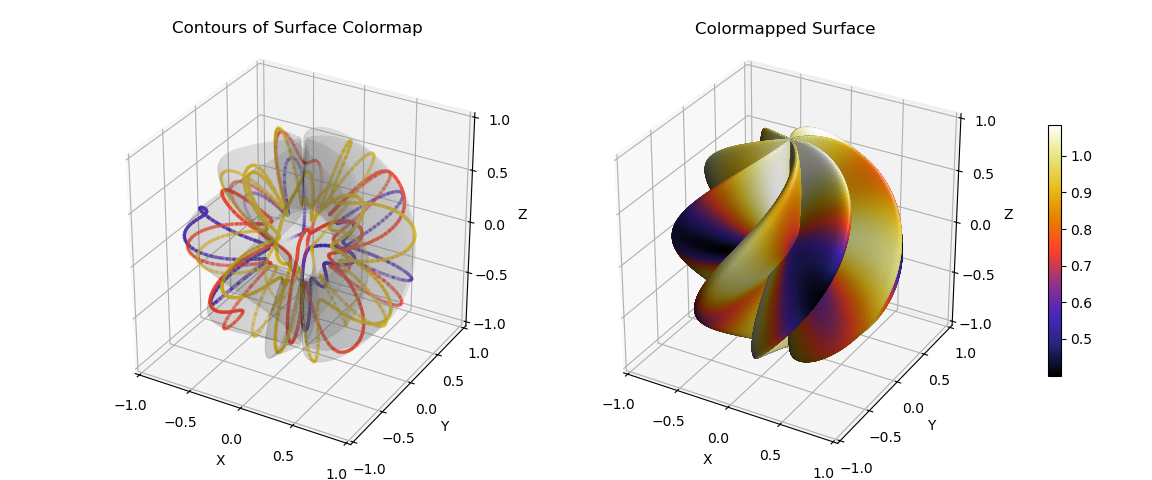
Contours of a Colormap on a Spherical Surface

This example is similar to Contours of a Colormap on a Planar Surface but for spherical coordinates.
The color values and geometric surface are defined in spherical coordinates. Since the native coordinates for contours are in Cartesian coordinates, the contour geometric mapping function is represented in those coordinates using coordinate transforms. This is highlighted in the following script.
import numpy as np
import matplotlib.pyplot as plt
import s3dlib.surface as s3d

# 1. Define function to examine .....................................
def deflate(rtp) :
    r,t,p = rtp
    scale = 0.3
    Rz = np.cos(p)
    Rxys = (1-scale)*np.sin(p) + scale*np.cos(4*t)
    R = np.sqrt( Rz**2 + Rxys**2)
    return R,t,p

def swirl(rtp) :
    r,t,p = rtp
    u,v = t,p
    R = 2 + np.sin(7*u + 5*v)
    return R/3,t,p

def geometric_XYZ(xyz) :
    # Note: the geometry is defined in rtp coordinates
    #       but contours are in xyz coordinates.
    rtp = s3d.SphericalSurface.coor_convert(xyz,False)
    rtp = geometric_R(rtp)
    return s3d.SphericalSurface.coor_convert(rtp,True)

geometric_R = lambda c : swirl(c)
color_R     = lambda c : deflate(c)

# 2. Setup and map surfaces .........................................
ncont, cmap, mlt = 3, 'CMRmap', 40

surface = s3d.SphericalSurface.grid(3*mlt,5*mlt,minrad=0.01,color='.8')
surface.map_geom_from_op(geometric_R)
surface.set_surface_alpha(.1)

surface_c = s3d.SphericalSurface.grid(5*mlt,7*mlt,minrad=0.01)
surface_c.map_geom_from_op(geometric_R)
surface_c.map_cmap_from_op( lambda c : color_R(c)[0] , cmap)

surface_t = s3d.SphericalSurface.grid(3*mlt,5*mlt,minrad=0.01,color='.8')
surface_t.map_geom_from_op(color_R)       # temp 'colormap' surface geometry
surface_t.map_cmap_from_op(cmap=cmap )
contours = surface_t.contourLineSet(ncont,coor='s')
contours.map_geom_from_op(geometric_XYZ)  # map R to the geometric surface
contours.set_linewidth(2.5)

# 3. Construct figure, add surface, plot ............................

minmax, ticks = (-1,1), [-1,-.5,0,.5,1]
fig = plt.figure(figsize=plt.figaspect(0.5/1.2))
ax1 = fig.add_subplot(121, projection='3d', aspect='equal')
ax2 = fig.add_subplot(122, projection='3d', aspect='equal')
ax1.set(xlim=(-1,1), ylim=(-1,1), zlim=(-1,1),
            xticks=ticks, yticks=ticks, zticks=ticks, xlabel='X', ylabel='Y', zlabel='Z', )
ax2.set(xlim=(-1,1), ylim=(-1,1), zlim=(-1,1),
            xticks=ticks, yticks=ticks, zticks=ticks, xlabel='X', ylabel='Y', zlabel='Z', )

ax1.set_title('Contours of Surface Colormap')
ax1.add_collection3d(surface.shade( ) )
ax1.add_collection3d(contours.fade())

ax2.set_title('Colormapped Surface')
ax2.add_collection3d(surface_c.shade( ).hilite(.6,focus=2) )
plt.colorbar(surface_c.cBar_ScalarMappable, ax=ax2,  shrink=0.6, pad=.1 )

fig.tight_layout(pad=1.5)
plt.show()
