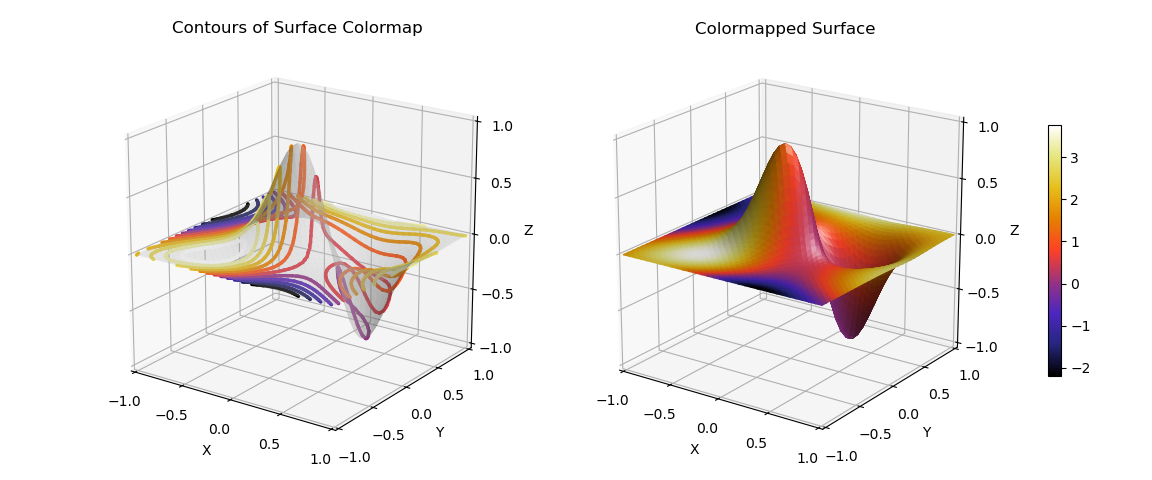
Contours of a Colormap on a Planar Surface

Values, g(x,y,z), on a surface are reprsented as colors mapped on the surface geometry, f(x,y,z). Most often, g(x,y,z) is simply used for f(x,y,z) when colormapping, e.g. Hello World Example and Function Plots, z = f(x,y). Alternatively, examples Color Mapping Using Functions and Scalar Function Colormapping on a 3D Surface illustrate cases when different functions are used for colormapping on a geometry.
Contour lines on a 3D surface are generally created for planes intersecting the surface geometry, f(x,y,z), and viewed on the geometric surface, f(x,y,z). See Vertical Contour Set or Colored Surface Contour Set for example.
In this example, contour lines are for planes intersecting the values, g(x,y,z), but viewed on the geometric surface, f(x,y,z) by mapping the contour lines to the geometric surface. (see the highlighted line below)
import numpy as np
import matplotlib.pyplot as plt
import s3dlib.surface as s3d

# 1. Define function to examine .....................................

def Image_demo(xyz) : # ..... for surface geometry
    x,y,z = xyz
    X,Y = 3*x, 3*y
    Z1 = np.exp(-X**2 - Y**2)
    Z2 = np.exp(-(X - 1)**2 - (Y - 1)**2)
    Z = Z1-Z2
    return x,y,Z

def peaks(xyz) :      # ..... for surface colormapping
    x,y,z = xyz
    z =  3*(1 - x)**2 * np.exp(-x**2 - (y + 1)**2) \
        - 10*(x/5 - x**3 - y**5)*np.exp(-x**2 - y**2) \
        - 1./3*np.exp(-(x + 1)**2 - y**2)
    return x,y,z

geometric_Z = lambda c : Image_demo(c)
color_Z     = lambda c : peaks(c)

# 2. Setup and map surfaces .........................................
ncont, cmap, rez = 12, 'CMRmap', 5

surface = s3d.PlanarSurface(rez,color='.8')
surface.map_geom_from_op(geometric_Z)
surface.set_surface_alpha(.25)

surface_c = s3d.PlanarSurface(rez)
surface_c.map_geom_from_op(geometric_Z)
surface_c.map_cmap_from_op( lambda c : color_Z(c)[2] , cmap)

surface_t = s3d.PlanarSurface(rez)
surface_t.map_geom_from_op(color_Z)  # temp 'colormap' surface geometry
contours = surface_t.contourLineSet(ncont)
contours.map_cmap_from_op( lambda c : c[2], cmap)
contours.map_geom_from_op(geometric_Z)  # map Z to the geometric surface
contours.set_linewidth(2.5)

# 3. Construct figure, add surface, plot ............................

minmax, ticks = (-1,1), [-1,-.5,0,.5,1]
fig = plt.figure(figsize=plt.figaspect(0.5/1.2))
ax1 = fig.add_subplot(121, projection='3d', aspect='equal')
ax2 = fig.add_subplot(122, projection='3d', aspect='equal')
ax1.view_init(20,-55)
ax2.view_init(20,-55)
ax1.set(xlim=(-1,1), ylim=(-1,1), zlim=(-1,1), xlabel='X', ylabel='Y', zlabel='Z',
            xticks=ticks, yticks=ticks, zticks=ticks )
ax2.set(xlim=(-1,1), ylim=(-1,1), zlim=(-1,1), xlabel='X', ylabel='Y', zlabel='Z',
            xticks=ticks, yticks=ticks, zticks=ticks )

ax1.set_title('Contours of Surface Colormap')
ax1.add_collection3d(surface.shade( ) )
ax1.add_collection3d(contours)

ax2.set_title('Colormapped Surface')
ax2.add_collection3d(surface_c.shade( ).hilite(.6,focus=2) )
plt.colorbar(surface_c.cBar_ScalarMappable, ax=ax2,  shrink=0.6, pad=.1 )

fig.tight_layout(pad=1.5)
plt.show()
