
Lab Point Cloud
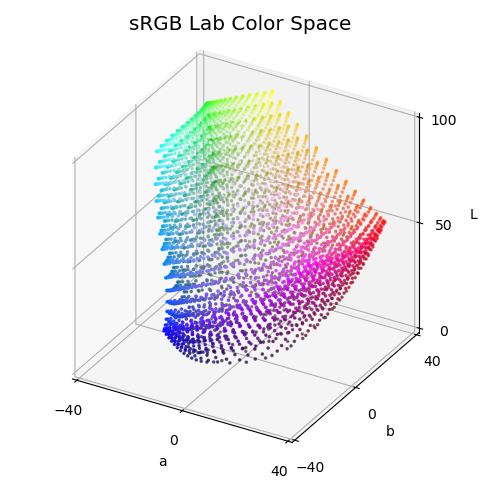
This figure shows the geometric transformation of the point cloud into another domain. The following script is similiar to script in the Color Space example. In both cases, the sequence is:
an object is created.
the object is color mapped using a function ( map_color_from_op )
the object geometry is mapped using a function ( map_geom_from_op )
and finally, the object is added to the 3-D axis.
import numpy as np
from matplotlib import pyplot as plt
import s3dlib.surface as s3d
import s3dlib.pntcloud as ptc
from colorspacious import cspace_converter

#.. Lab Color Space Cloud

# 1. Define function to examine ....................................

def rgb_to_labCoor(rgb):
    L,a,b = cspace_converter("sRGB1", "CAM02-UCS"  )(rgb.T).T
    return a,b,L

# 2. Setup and map point cloud .....................................

cloudObj = ptc.Point3DCloud(1.5,domain=[0,1])
cloudObj.map_color_from_op(lambda xyz : xyz)
cloudObj.map_geom_from_op(rgb_to_labCoor)

# 3. Construct figure, add surface plot ............................

fig = plt.figure(figsize=plt.figaspect(1))
ax = plt.axes(projection='3d', aspect='equal', proj_type='ortho')
ax.set( xlim=(-40,40),     ylim=(-40,40),     zlim=(0,100),
        xlabel='a',        ylabel='b',        zlabel='L',
        xticks=[-40,0,40], yticks=[-40,0,40], zticks=[0,50,100])
ax.set_title( 'sRGB Lab Color Space', fontsize='x-large' )

cloudObj.add_to3d(ax)

fig.tight_layout()
plt.show()