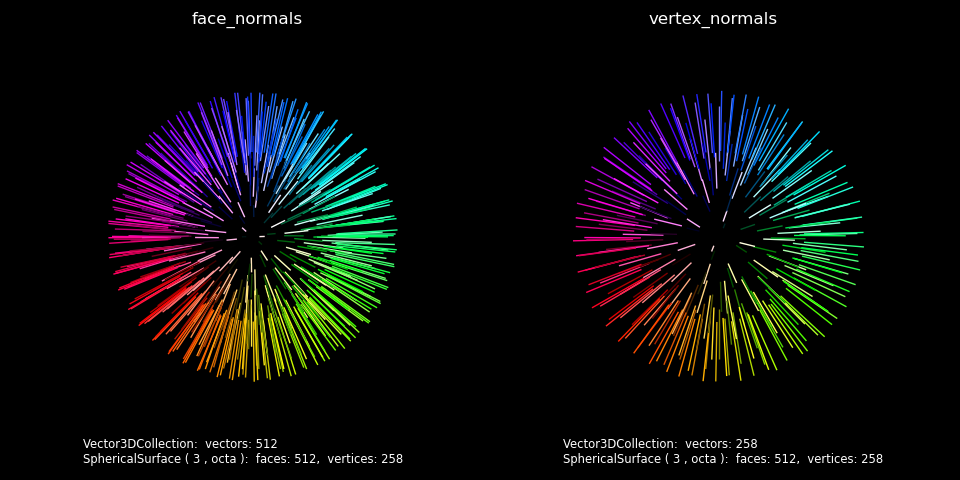
import numpy as np
import matplotlib.pyplot as plt
import s3dlib.surface as s3d
import copy

#.. Surface Normal Color Mapping

# 1. Define functions to examine ....................................

def rgbColorXYZ(xyz) :
    x,y,z = xyz
    c = np.sqrt(3)
    R = ( c*x + 1 ) /2.0
    G = ( c*y + 1 ) /2.0
    B = ( c*z + 1 ) /2.0
    return R,G,B

def rgbColorRTP(rtp) :
    xyz = s3d.SphericalSurface.coor_convert( rtp, tocart=True )
    return rgbColorXYZ(xyz)

def rgbColor_position(xyz,uvw) :  # vectors map need both xyz & uvw
    return rgbColorXYZ(xyz)

# 2. Setup and map surfaces .........................................
rez, vlen = 3, 0.7

surface = s3d.SphericalSurface(rez, basetype='octa')
surface.map_color_from_op(rgbColorRTP)

vf1 = surface.facenormals(scale=vlen)
vf2 = surface.vertexnormals(scale=vlen)

# 3. Construct figure, add surfaces, and plot ......................

vect = [ vf1, vf2 ]
fig = plt.figure(figsize=plt.figaspect(0.5), facecolor='k')

fig.text(0.086,0.03,str(vf1)+'\n'+str(surface), color='w',
    ha='left', va='bottom', fontsize='smaller', multialignment='left')
fig.text(0.086+0.5,0.03,str(vf2)+'\n'+str(surface), color='w',
    ha='left', va='bottom', fontsize='smaller', multialignment='left')
minmax=(-1.4,1.4)

for i in range(2) :
    vf = vect[i]
    vf.alr = 0
    ax = fig.add_subplot(121+i, projection='3d', facecolor='k', aspect='equal')
    ax.set_title(vf.name, color='w')
    ax.set(xlim=minmax, ylim=minmax, zlim=minmax)
    ax.set_axis_off()
    ax.view_init(30,30)
    ax.add_collection3d(vf)

fig.tight_layout(pad=2)

plt.show()


