
Color Mapped Line Segments
Line object color can be defined using color maps based on three line methods for
segment orientation
segment sequence
Cartesian coordinate segment position
Color Mapping from Orientation
Segment color can be based on the segment orientation using the line object method:
line.map_cmap_from_direction( cmap, direction=None, isAbs=False )
The cmap argument is a color map or registered color map name. The direction argument is a 3D array in x,y,z coordinates. The value used for the color map index is the dot product of the direction with the progressive sequence direction. The isAbs is True if the sign of the dot product is ignored. If no arguments are provided the default values for cmap, direction are viridis, the Matplot default, and [1,0,1], respectively.
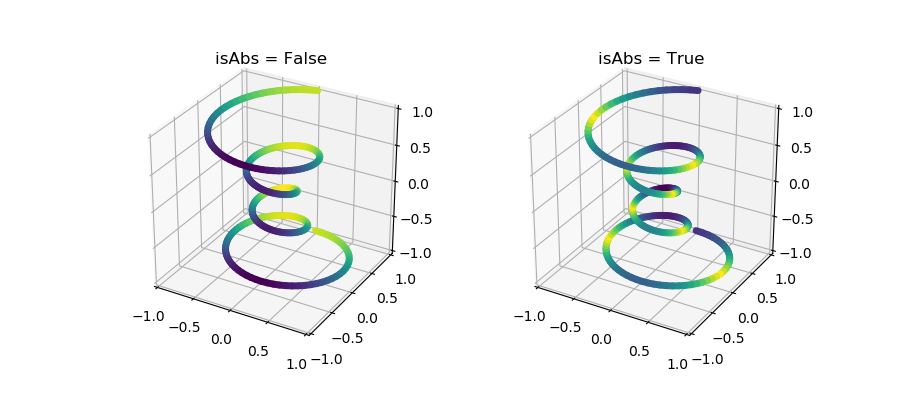
which was generated by the following script. Note that the linewidth was set to 5 in the constructors (lw=5) to emphasize the coloring.
import numpy as np
from matplotlib import pyplot as plt
import s3dlib.surface as s3d

# 1. Define function to examine .....................................

def parametric_curve(t) :
    #...   0 < t < 1
    sc = (2*t -1 )
    r_0, twists = .25, 4
    z = sc
    r = r_0 + (1-r_0)*z**2
    theta = twists*np.pi*sc
    x = r*np.sin(theta)
    y = r*np.cos(theta)
    return x,y,z

# 2. Setup and map line .............................................
rez=7

line_1 = s3d.ParametricLine(rez,parametric_curve, lw=5)
line_1.map_cmap_from_direction()

line_2 = s3d.ParametricLine(rez,parametric_curve, lw=5)
line_2.map_cmap_from_direction(isAbs=True)

# 3. Construct figure, add line and plot ...........................

fig = plt.figure(figsize=(9,4))

ax1 = fig.add_subplot(121, projection='3d')
ax1.set(xlim=(-1,1), ylim=(-1,1), zlim=(-1,1) )
ax1.set_title('isAbs = False')
ax1.set_aspect('equal')
ax1.add_collection3d(line_1)
# .........
ax2 = fig.add_subplot(122, projection='3d')
ax2.set(xlim=(-1,1), ylim=(-1,1), zlim=(-1,1) )
ax2.set_title('isAbs = True')
ax2.set_aspect('equal')

ax2.add_collection3d(line_2)
# .........

plt.show()
This cmap method is analogous to the surface normal mapping where, for a line, orientation is used for mapping. As with surfaces, the 3D visualization of lines may be enhanced by shading using the method:
line.shade( depth, direction, contrast )
where the method arguments are described in the Color Mapped Surface Normals tutorial or the Shading guide. These two methods will produce similar results for visualization as shown in the following figure.

import numpy as np
from matplotlib import pyplot as plt
import s3dlib.surface as s3d
import s3dlib.cmap_utilities as cmu

# 1. Define function to examine .....................................

def parametric_curve(t) :
    #...   0 < t < 1
    sc = (2*t -1 )
    r_0, twists = .25, 4
    z = sc
    r = r_0 + (1-r_0)*z**2
    theta = twists*np.pi*sc
    x = r*np.sin(theta)
    y = r*np.cos(theta)
    return x,y,z

# 2. Setup and map line .............................................
rez=7
line_color = [1,.9,.75]
cmu.rgb_cmap_gradient([0.25,0.15,0],line_color,'cardboard')

line_1 = s3d.ParametricLine(rez,parametric_curve,color=line_color,lw=5)
line_1.shade()

line_2 = s3d.ParametricLine(rez,parametric_curve,cmap='cardboard',lw=5)
line_2.map_cmap_from_direction(isAbs=True)

# 3. Construct figure, add line, and plot ...........................

fig = plt.figure(figsize=(9,4))

ax1 = fig.add_subplot(121, projection='3d')
ax1.set(xlim=(-1,1), ylim=(-1,1), zlim=(-1,1) )
ax1.set_title('shaded')
ax1.set_aspect('equal')

ax1.add_collection3d(line_1)
# .........
ax2 = fig.add_subplot(122, projection='3d')
ax2.set(xlim=(-1,1), ylim=(-1,1), zlim=(-1,1) )
ax2.set_title('cmap (isAbs=True)')
ax2.set_aspect('equal')

ax2.add_collection3d(line_2)
# .........

plt.show()
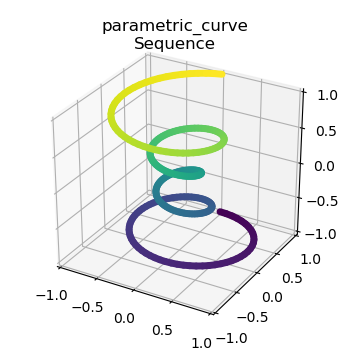
Color Mapping Using Segment Sequence
Colormaps are applied from the start to end to the line segments using:
line.map_cmap_from_sequence(cmap)
The Matplot default viridis colormap is used if no color map argument, cmap, is specified. When applied to the parametric line example, the resulting line plot is
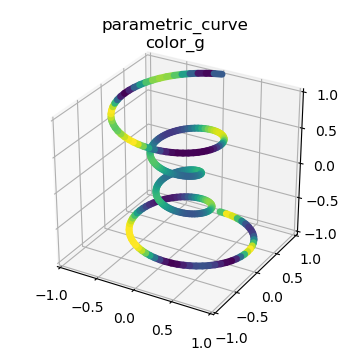
Color Mapping Using a Function
Line color can be defined from function values that are mapped to colors using colormaps by calling the line object method:
line.map_cmap_from_op( operation, cmap )
The op argument is a function with coordinate arguments and returning a single value. The cmap argument is a color map or registered color map name. Returned function values at segment coordinates are normalized and colors mapped from the colormap.
For example, defining the functional operation as:
def color_g(xyz) :
    x,y,z = xyz
    Z = np.sin(x*y*3*np.pi )
    return Z
for the parametric line object mapped using this function is
Influence of Line Rez
Since color mapping is applied to each segment, the line segment sizes control the smoothness of the color variations.
For parametric lines, the segment size is controlled by the rez argument of the constructor. The previous sequential cmap example for different rez are shown below.

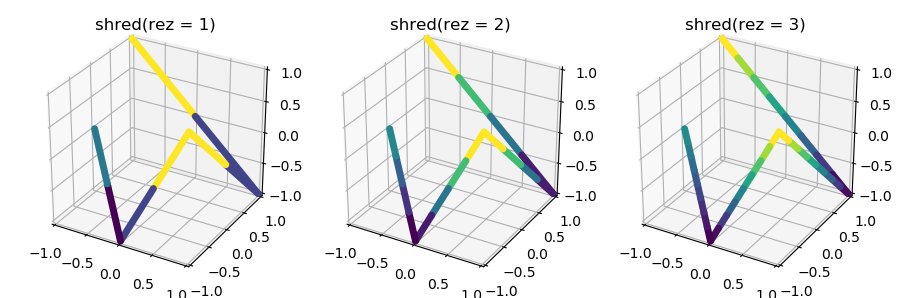
In addition, the line segments can be increased along each initial segment using the method:
line.shred(rez)
Where rez is the recursive number of doubling the line segments. For the simple four segment line color mapped in the z-direction, the effect of applying this method for various rez values is
This shred method can be applied to any line object. For the parametric line example, applying colormapping after applying the shred method is shown below.
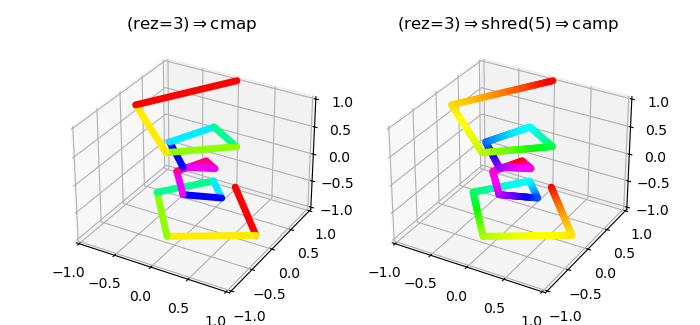
The value of the rez in the line constructor influences the smoothness of the geometry. Further applying shred provides a smoothness in the colormapping.