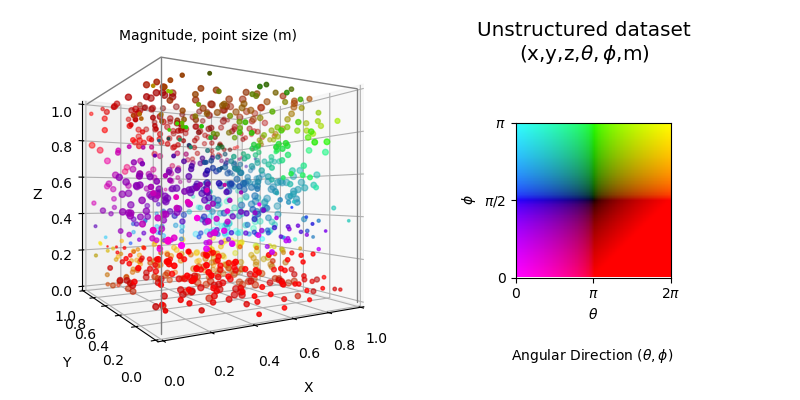
import numpy as np
import matplotlib.pyplot as plt
from mpl_toolkits.axes_grid1.inset_locator import zoomed_inset_axes
import s3dlib.surface as s3d
import s3dlib.cmap_utilities as cmu

#.. Unstructured dataset (x,y,z,t,p,m) scatter plot, Dual Colormap

# dataset generation function ....................................
def get_dataset(N) :
    np.random.seed(3)
    x = np.random.uniform(0, 1, N)
    y = np.random.uniform(0, 1, N)
    z = np.random.uniform(0, 1, N)
    # u,v,w functions from Mayavi vector field...
    u =    np.sin(np.pi*x) * np.cos(np.pi*z)
    v = -2*np.sin(np.pi*y) * np.cos(2*np.pi*z)
    w = np.cos(np.pi*x)*np.sin(np.pi*z) + np.cos(np.pi*y)*np.sin(2*np.pi*z)
    _,theta,phi = s3d.SphericalSurface.coor_convert([u,v,w])
    vector = np.reshape(np.array( [u,v,w] ).T,(-1,3))
    vectMag = np.linalg.norm(vector,axis=1)[:,np.newaxis]
    return x,y,z,theta,phi,vectMag.T[0]

# custom DualCmap ....................................
kr = cmu.hsv_cmap_gradient( [0.00,1,0], [0.00,1,1], name='black_red' )
kg = cmu.hsv_cmap_gradient( [0.33,1,0], [0.33,1,1], name='black_green' )
bk = cmu.hsv_cmap_gradient( [0.67,1,1], [0.67,1,0] )
rk = cmu.hsv_cmap_gradient( [0.00,1,1], [0.00,1,0] )
bkr = cmu.stitch_cmap(bk,kr, name='blue_k_red')
rkg = cmu.stitch_cmap(rk,kg, name='red_k_green')
dcmap = cmu.DualCmap(bkr,rkg,'srt',name='mcyr')

# generate data, construct figure, add pomts, and plot ......................
N,scale = 1000, 10.0
x,y,z,t,p,m = get_dataset(N)
figLabel = 'Unstructured dataset\n(x,y,z,'+r'$\theta,\phi$,m)'
note_0 =   'Magnitude, point size (m)'
note_1 =  r'Angular Direction ($\theta,\phi)$'
vE,iE = [ [0,1,1], [0,0,1], [1,0,1], [0,0,0], [1,0,0] ], [ [0,1,2],[1,3],[2,4]]

fig = plt.figure(figsize=(8,4),facecolor='w')
fig.text(0.73,.85,figLabel,fontsize='x-large',ha='center')
fig.text(0.26,.90,note_0,  fontsize='medium',  ha='center')
fig.text(0.74,.10,note_1,  fontsize='medium',  ha='center')
# ........................
ax = fig.add_subplot(121, projection='3d', aspect='equal', focal_length=0.25)
ax.view_init(0,-120)
ax.set( xlim=[0,1],ylim=[0,1],zlim=[0,1], xlabel='X', ylabel='Y', zlabel='Z' )

ax.scatter(x,y,z, s=scale*m, c = dcmap(t,p).T)
ax.add_collection3d( s3d.ColorLine3DCollection(vE,iE,color='0.5',lw=1) )
# ........................
ax = fig.add_subplot(122, aspect='equal')
ax.set_axis_off()
axins = zoomed_inset_axes(ax, zoom=-0.45, loc='center')
y,x = np.mgrid[ 1:0:100j,0:1:100j ]
axins.imshow(dcmap(x,y).T,  extent=[0,1,0,1])
axins.set(xticks=[0,.5,1],yticks=[0,.5,1],xlabel=r'$\theta$',ylabel=r'$\phi$',aspect='equal')
axins.set_xticklabels(['0',r'$\pi$',r'2$\pi$'])
axins.set_yticklabels(['0',r'$\pi$/2',r'$\pi$'])
# ........................
fig.tight_layout(pad=2)
plt.show()