
Domain map of a Complex Function
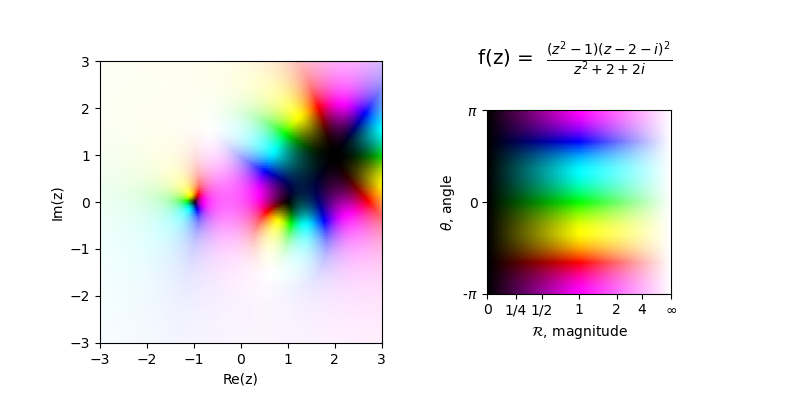
This complex function is shown as a pair 3D plots for the magnitude and direction in the Domain Coloring example. As an alternative, these two components are shown in a single 2D plot using a Dualcmap.
import numpy as np
import matplotlib.pyplot as plt
import s3dlib.cmap_utilities as cmu
from s3dlib.surface import PolarSurface as ps
from mpl_toolkits.axes_grid1.inset_locator import zoomed_inset_axes

#.. Complex xy Representation, Dual Colormaps

# 1. Define function to examine ....................................

def complexFunc(z) :
    i = 1j
    num = (z**2 - 1)*(z - 2 -i)**2
    dem = z**2 + 2 + 2*i
    f = num/dem
    r = np.abs(f)                      #.. [0,inf]
    Rmag = 2*np.arctan(r)/np.pi        #.. [0,1]
    theta = (1 + np.angle(f)/np.pi)/2  #.. [0,1]
    Z = Rmag + theta*i
    return Z

def cmpCmap(x,y,func,cmap) :
    f = func(x+y*1j)
    return cmap(f.real, f.imag)

# 2. Setup values ........................................
m_m = cmu.hue_cmap( 5/6, 11/6, name='hsvRdToGn' )
dcmap = cmu.DualCmap('binary_r',m_m,kind='l_y',name='hsv_l')

y,x = np.mgrid[ 3:-3:100j,-3:3:300j ]  # note: imshow uses rows, columns
mmMagDot3, mmMagDot = [-3,3,-3,3], [0,1,0,1]
r_labels = [ '0','1/4','1/2','1','2','4',r'$\infty$']
r_axvals = [0] + [ 2*np.arctan(2**i)/np.pi for i in range(-2,3)] + [1]

# 3. Construct figure, add 2-d surface, and plot ......................
fig = plt.figure(figsize=(8,4),facecolor='w')
info = r" f(z) =  $\frac{(z^{2}-1)(z-2-i)^{2}}{z^{2}+2+2i}$  "
fig.text(0.72,0.9,info, ha='center', va='top', fontsize='x-large')
#..........
ax = fig.add_subplot(121, aspect='equal')
ax.imshow(cmpCmap(x,y,complexFunc,dcmap).T, extent=mmMagDot3 )
ax.set(xlabel='Re(z)',ylabel=r'Im(z)')
#..........
ax = fig.add_subplot(122, aspect='equal')
ax.set_axis_off()
axins = zoomed_inset_axes(ax, zoom=-0.65, loc='center')
axins.imshow(dcmap(x,y).T, extent=mmMagDot)
axins.set(xlabel= r'$\mathcal{R}$, magnitude',ylabel=r'$\theta$, angle')
axins.set_xticks(r_axvals )
axins.set_xticklabels(r_labels)
axins.set_yticks([0,0.5,1])
axins.set_yticklabels([r'-$\pi$','0',r'$\pi$'])

plt.show()