
Parametric Set 2
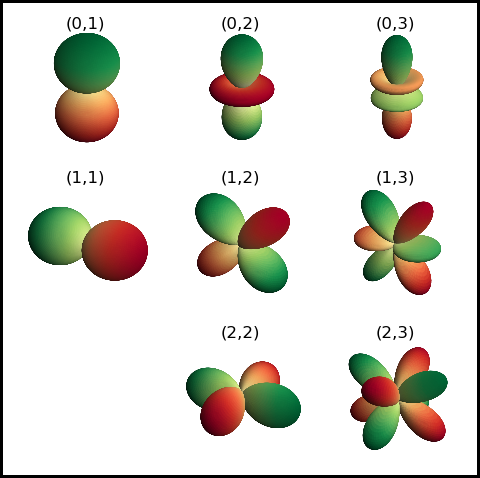
This example uses a parameterized version of the function in the Two methods of Representing example.
import numpy as np
from scipy import special as sp
import matplotlib.pyplot as plt
import s3dlib.surface as s3d

#.. Parametric Set 2

# 1. Define functions to examine ....................................

def sphHar(rtp, m, l) :
    r, theta, phi = rtp
    r = sp.sph_harm(m, l, theta, phi).real
    return r, theta, phi

def sphHar_absR(rtp, m, l) :
    r, theta, phi = sphHar(rtp, m, l)
    return np.abs(r), theta, phi

# 2 & 3. Setup surfaces and plot ....................................
rez = 5
fig = plt.figure(figsize=plt.figaspect(1),linewidth=3,edgecolor='k')

for m in range(3) :
    for l in range(1,4) :
        n = 3*m + l
        if n==7 : continue
        ax = fig.add_subplot(3,3,n, projection='3d', aspect='equal')
        surface = s3d.SphericalSurface(rez, cmap="RdYlGn")
        surface.map_cmap_from_op( lambda rtp : sphHar(rtp,m,l)[0] )
        surface.map_geom_from_op( lambda rtp : sphHar_absR(rtp,m,l) )
        rmax = 0.6*surface.bounds['rorg'][1]
        minmax = (-rmax,rmax)
        ax.set(xlim=minmax, ylim=minmax, zlim=minmax )
        ax.set_title('('+str(m)+','+str(l)+')' , fontsize='large')
        ax.add_collection3d(surface.shade())
        ax.set_axis_off()

fig.tight_layout()
plt.show()