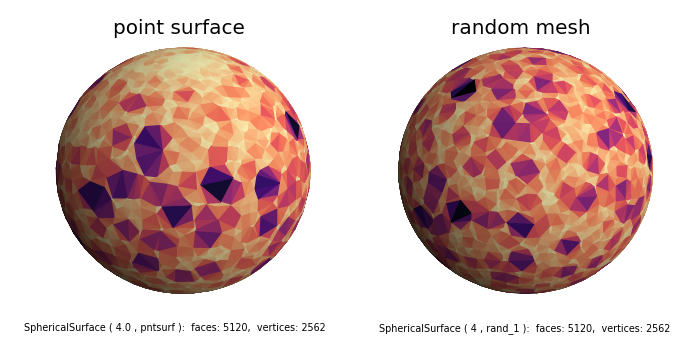
Pntsurf versus Rand Surfaces

In the above figure on the left, an irregular spherical mesh was be generated from a set of vertex points using the pntsurf method. Vertices in spherical coordinates were defined with a uniform distribution of azimuthal and polar angles along with a constant radial position. This is shown in the highlighted lines in the code below. The distribution of face sizes are smaller near the poles, a result of the azimuthal and polar angles of the vertex uniform distibutions. This is analogous to the grid areas on a globe.
An alternative irregular spherical mesh was generated using the rand method which is shown on the right. The rand method algorithm distributes the various face sizes uniformly throughout the spherical surface.
import numpy as np
import matplotlib.pyplot as plt
import s3dlib.surface as s3d

#.. Comparison between a data surface to a random surface.

# 1. Example data & parameters ....................................
seed = 1
rez,numbPnts = 4, 2562

np.random.seed(seed)
r = np.ones(numbPnts)
t = np.random.uniform(0,2*np.pi, numbPnts)
p = np.random.uniform(0,np.pi, numbPnts)
dataPts = np.array( [r,t,p] ).T

# 2. Setup and map surfaces .........................................
surfaces = [
    s3d.SphericalSurface.pntsurf(dataPts) ,
    s3d.SphericalSurface.rand(rez,seed=seed)
]
# 3. Construct figure, add surface, and plot ........................
minmax = (-.7,.7)
fig = plt.figure(figsize=(7,3.5))
for i,surf in enumerate(surfaces) :
    fig.text(0.25+.5*i, 0.05,str(surf),ha='center',fontsize='x-small')
    ax =fig.add_subplot(121+i, projection='3d', aspect='equal')
    ax.set(xlim=minmax, ylim=minmax, zlim=minmax)
    ax.set_axis_off()
    ax.set_title(surf.name,fontsize='x-large')
    surf.map_cmap_from_op(lambda c:c[0],'magma')
    ax.add_collection3d(surf.shade())

fig.tight_layout()

plt.show()
