
Hello World Grid Example 2
This example uses only a single geometric mapping of a lower resolution grid to visualize the functional surface shape.
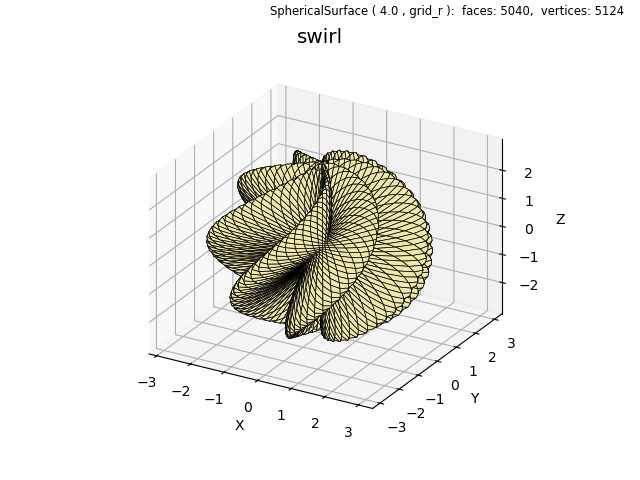
The function is described in the Matlab Parameterized Surface Plot .
import numpy as np
from matplotlib import pyplot as plt
import s3dlib.surface as s3d
import s3dlib.cmap_utilities as cmu

#.. swirl function from
#   https://www.mathworks.com/help/matlab/ref/fsurf.html#bu62pyy-21

# 1. Define function to examine .....................................

def swirl(rtp) :
    r,t,p = rtp
    u,v = t,p
    R = 2 + np.sin(7*u + 5*v)
    return R,t,p

# 2. Setup and map surfaces .........................................
mlt = 12
surface = s3d.SphericalSurface.grid(5*mlt,7*mlt,'r',color='palegoldenrod',edgecolor='k',lw=0.5)
surface.map_geom_from_op( swirl )

# 3. Construct figure, add surface, plot ............................

fig = plt.figure()
fig.text(0.975,0.99,str(surface), ha='right', va='top', fontsize='smaller')
ax = plt.axes(projection='3d')
ax.set_title(surface.name, fontsize='x-large')
ax.set( xlabel='X', ylabel='Y', zlabel='Z')
ax.view_init(30,-130)
ax.set_proj_type('ortho')
s3d.auto_scale(ax,surface)
ax.view_init(25)

ax.add_collection3d(surface)

fig.tight_layout(pad=2)
plt.show()