
Vector Surfaces
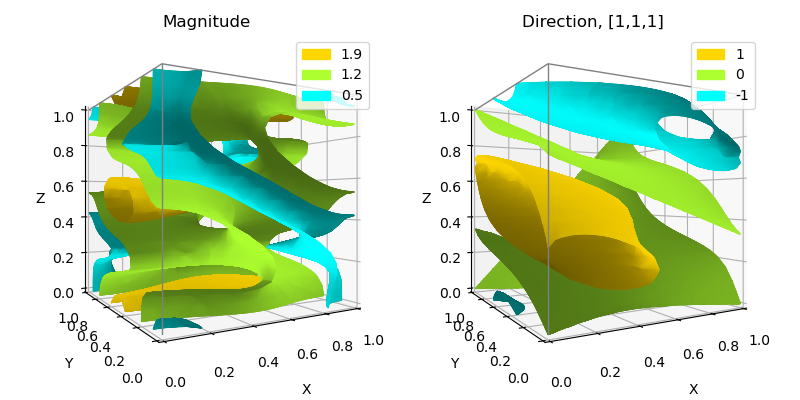
Using the vector field shown in the Magnitude and Direction Visualization example, surfaces of constant vector magnitude are shown on the left. On the right, surfaces are shown for contant component of the vector field in the [1,1,1] direction (dot product values).
The magnitude surface plot is similar to that found at Mayavi vector field .
Additional visualization of this vector field using a dual colormap is given in the Vector DualCmap example.
import numpy as np
import matplotlib.pyplot as plt
import s3dlib.surface as s3d
import matplotlib.patches as patches

#.. Vector magnitude and direction surfaces

# 1. Define functions to examine ....................................

def getVect(xyz) :
    x,y,z = xyz
    u =    np.sin(np.pi*x) * np.cos(np.pi*z)
    v = -2*np.sin(np.pi*y) * np.cos(2*np.pi*z)
    w = np.cos(np.pi*x)*np.sin(np.pi*z) + np.cos(np.pi*y)*np.sin(2*np.pi*z)
    return np.array([u,v,w]).T

def vector_mag(xyz) :
    return np.linalg.norm(getVect(xyz),axis=3).T

def vector_dot(xyz) :
    direction = [1,1,1]
    incidentDir = np.divide( direction, np.linalg.norm(direction) )
    return np.dot(getVect(xyz),incidentDir).T

rez,dmn,col = 4, [0, 1], ['gold', 'limegreen' ,'cyan']
params = [ [ 'Magnitude',          vector_mag, [1.9,1.2,0.5] ] ,
           [ 'Direction, [1,1,1]', vector_dot, [ 1, 0,  -1 ] ]   ]

# 3. Construct figure, add surface, and plot ......................
fig = plt.figure(figsize=(8,4),facecolor='w')
for i,pms  in enumerate(params) :
    title, vectFunc, mVal =  pms   # set parmeters to the specific visualization.
    ax = fig.add_subplot(121+i, projection='3d', aspect='equal', focal_length=0.25)
    ax.view_init(0,-120)
    ax.set(xlim=dmn, ylim=dmn, zlim=dmn, title=title, xlabel='X',  ylabel='Y',  zlabel='Z' )
    hnd = [ patches.Patch(label='value = {:.2f}'.format(mVal[i]), color=col[i]) for i in range(len(mVal)) ]
    ax.legend(handles=hnd)

    # 2. Setup and map surfaces .................
    surface = s3d.Surface3DCollection.implsurf( vectFunc,rez,dmn,*mVal,color=col )
    surface.evert()

    ax.add_collection3d(surface.shade(.4,ax=ax).hilite(.5,ax=ax))
    s3d.add_boxCorner(ax,dmn)

fig.tight_layout(pad=2)
plt.show()