
Hyperboloid of Revolution
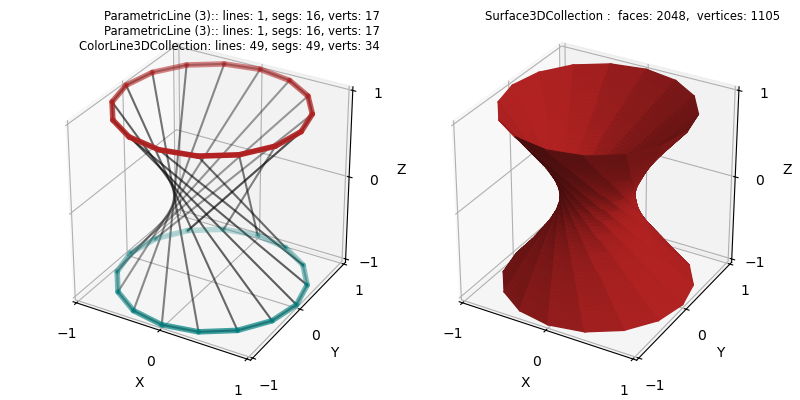
Parametric circular lines are rotated relative to each other, then the surface is created by projecting one circle to the other. The quadrangular faced surface is then triangulated to improve the visualization in the rendering.
import numpy as np
from matplotlib import pyplot as plt
import s3dlib.surface as s3d

#.. Hyperboloid of Revolution

# 1. Define functions to examine ....................................

def circle(t,r,z,twist) :
    theta = (2*t+twist)*np.pi
    x = r*np.cos(theta)
    y = r*np.sin(theta)
    z = z*np.ones(len(t))
    return x,y,z

radius, twist = 1, 0.75
top_circle = lambda t: circle(t,radius,1,0.0)
btm_circle = lambda t: circle(t,radius,-1.0,twist)

# 2. Setup and map surfaces .........................................
rez=3

line_1 = s3d.ParametricLine(rez,top_circle,color='firebrick')
line_2 = s3d.ParametricLine(rez,btm_circle,color='teal')
lines = line_1 + line_2
lines.set_linewidth(4)

edges = line_1.get_surface_to_line(line_2).edges # create temp surface for 'simple' edges.
edges.set_color('k')

surface = line_1.get_surface_to_line(line_2,lrez=6) # surface takes line_1 color.
surface.triangulate()

# 3. Construct figure, add surfaces, and plot ......................

minmax,ticks=(-1,1), [-1,0,1]
fig = plt.figure(figsize=(8,4))
label = [ str(line_1) +'\n' + str(line_2) +'\n' + str(edges) , str(surface) ]

for i in range(2):
    fig.text(0.5*i+0.475,0.975,label[i], ha='right', va='top', fontsize='smaller', multialignment='right')
    ax= fig.add_subplot(121+i, projection='3d', aspect='equal')
    ax.set(xlim=minmax, ylim=minmax, zlim=minmax,
            xlabel='X', ylabel='Y', zlabel='Z',
            xticks=ticks, yticks=ticks, zticks=ticks
        )
    if i==0 :
        ax.add_collection3d(edges.fade())
        ax.add_collection3d(lines.fade(.25))
    else:
        ax.add_collection3d(surface.shade(.25,ax=ax))

fig.tight_layout(pad=2)
plt.show()