
Line to Filled Line Surface Construction
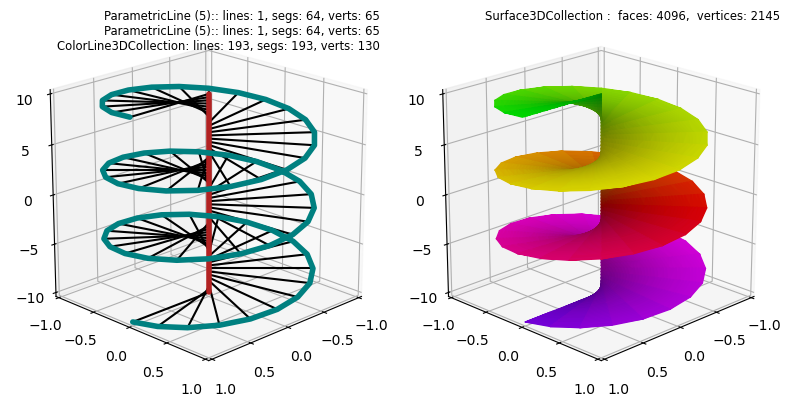
The Sliced Polar Surface example surface was constructed by mapping a base PolarSurface object. Being a ruled surface, the surface may be alternatively constructed using the line method get_surface_to_line from vertical and helical lines. This alternative provides a smoother surface along the origin where the edges are explicitly defined.
import numpy as np
from matplotlib import pyplot as plt
import s3dlib.surface as s3d
import s3dlib.cmap_utilities as cmu

#.. Alternative Polar Surface Construction

# 1. Define functions to examine ....................................

def vertical_line(t):
    x = np.zeros(len(t))
    y = np.zeros(len(t))
    z = 2*t - 1
    return x,y, 10*z

def coil_line(t,k) :
    T = 2*k*np.pi*t
    x, y = np.cos(T), np.sin(T)
    z = 2*t - 1
    return x,y, 10*z

coil = lambda t : coil_line(t,3)

# 2. Setup and map surfaces .........................................
rez=5
purple2green = cmu.hue_cmap(lowHue="blueviolet", hiHue='+g',name="purple_green")

line_1 = s3d.ParametricLine(rez,vertical_line,color='firebrick')
line_2 = s3d.ParametricLine(rez,coil,color='teal')
lines = line_1 + line_2
lines.set_linewidth(4)

edges = line_1.get_surface_to_line(line_2).edges # create temp surface for 'simple' edges.
edges.set_color('k')

surface = line_1.get_surface_to_line(line_2,lrez=5).triangulate()
surface.map_cmap_from_op( lambda xyz : xyz[2], purple2green )

# 3. Construct figure, add surfaces, and plot ......................

minmax,ticks=(-1,1), [-1,-.5,0,0.5,1]
fig = plt.figure(figsize=(8,4))
label = [ str(line_1) +'\n' + str(line_2) +'\n' + str(edges) , str(surface) ]

for i in range(2):
    fig.text(0.5*i+0.475,0.975,label[i], ha='right', va='top', fontsize='smaller', multialignment='right')
    ax= fig.add_subplot(121+i, projection='3d', aspect='equal')
    ax.view_init(20, 45)
    ax.set(xlim=minmax, ylim=minmax, zlim=(-10,10),
            xticks=ticks, yticks=ticks, zticks=[-10,-5,0,5,10]
        )
    if i==0 :
        ax.add_collection3d(edges)
        ax.add_collection3d(lines)
    else:
        ax.add_collection3d(surface.shade(direction=[0,0,1]))

fig.tight_layout()
plt.show()