
Filled ParametricLine Surface 2
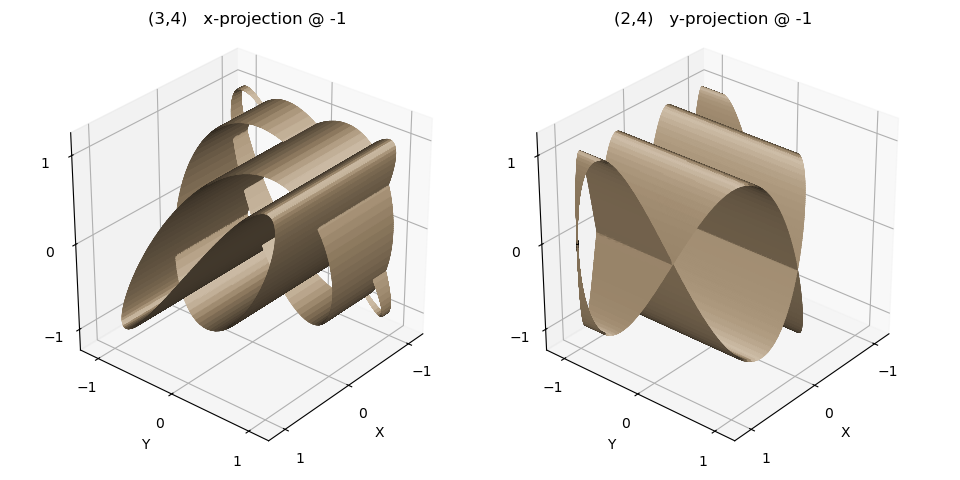
Using the function from the Parametric Set of Lines example, lines for values (3,4) and (2,4) are projected onto the y-z and x-z planes at the plane base argument of -1.
Note
The z-order of faces is based on the face centers. Surface fills use rectangular faces of various heights. Depending on the visualization orientation (view_init), the center of a face may cause the entire face to block a face which is positioned ahead. A solution to this effect is to subdivide the faces into smaller faces using the triangulation method. The degree of triangulation will depend on the view orientation and the filled line geometry. See the Surface Rendering Control guide.
These particular surfaces are triangulated (highlighted lines) to provide multiple faces with centers that vary in the vertical direction.
import numpy as np
import matplotlib.pyplot as plt
import s3dlib.surface as s3d

# 1. Define function to examine .....................................

def generalizedFunc(t, ny, nz) :
    t = 2*np.pi*t
    x, y, z = np.sin(t), np.cos(ny*t), np.sin(nz*t)
    return x,y,z

# 2. Setup and map surfaces .........................................
rez, lrez, trez = 7, 4, 2

surfaces = [None]*2

line = s3d.ParametricLine(rez,
            lambda t : generalizedFunc(t,3,4), color='tan',lw=3 )
surfaces[0] = line.get_filled_surface(dist=-1,coor='x',lrez=lrez).triangulate(trez)
surfaces[0].name = "(3,4)   x-projection @ -1"

line = s3d.ParametricLine(rez,
            lambda t : generalizedFunc(t,2,4), color='tan',lw=3 )
surfaces[1] = line.get_filled_surface(dist=-1,coor='y',lrez=lrez).triangulate(trez)
surfaces[1].name = "(2,4)   y-projection @ -1"

# 3. Construct figure, add surfaces, and plot ......................

fig = plt.figure(figsize=plt.figaspect(0.5))
minmax,ticks = (-1.2,1.2), [-1,0,1]
for i, surface in enumerate(surfaces) :
    ax =  fig.add_subplot(121+i, projection='3d', aspect='equal')
    ax.set(xlim=minmax,  ylim=minmax,  zlim=minmax, xlabel="X", ylabel="Y",
        xticks=ticks, yticks=ticks, zticks=ticks )
    ax.set_title( surface.name, fontsize='large' )
    ax.view_init(30,40)

    ax.add_collection3d(surface.shade(direction=[1,1,1],ax=ax).hilite(direction=[1,1,1],ax=ax))
    ax.add_collection3d(surface.shade(direction=[1,1,1],ax=ax).hilite(direction=[1,1,1],ax=ax))
fig.tight_layout(pad=2)
plt.show()