
Filled ParametricLine Surface 1
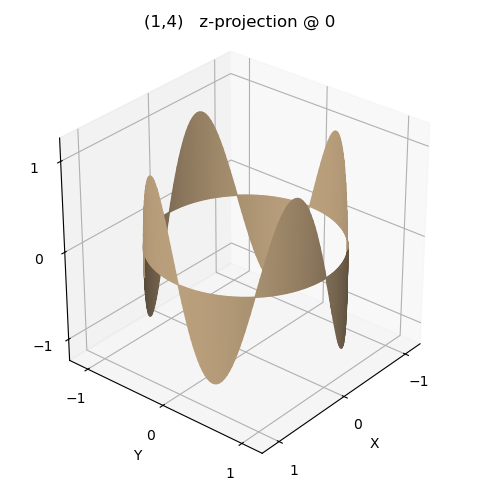
Using the function from the Parametric Set of Lines example, a line for values (1,4) is projected onto the x-y plane at z=0. Color of the surface is taken from the ‘shaded’ line.
import numpy as np
import matplotlib.pyplot as plt
import s3dlib.surface as s3d

# 1. Define function to examine .....................................

def generalizedFunc(t, ny, nz) :
    t = 2*np.pi*t
    x, y, z = np.sin(t), np.cos(ny*t), np.sin(nz*t)
    return x,y,z

# 2. Setup and map surfaces .........................................

line = s3d.ParametricLine(7,
            lambda t : generalizedFunc(t,1,4), color='tan' )
surface = line.get_filled_surface()
surface.name = '(1,4)   z-projection @ 0'

# 3. Construct figure, add surfaces, and plot ......................
minmax,ticks = (-1.2,1.2), [-1,0,1]
fig = plt.figure(figsize=plt.figaspect(1))
ax = plt.axes(projection='3d', aspect='equal')
ax.set(xlim=minmax,  ylim=minmax,  zlim=minmax, xlabel="X", ylabel="Y",
       xticks=ticks, yticks=ticks, zticks=ticks )
ax.set_title( surface.name, fontsize='large' )
ax.view_init(30,40)

ax.add_collection3d(surface.shade(.2,ax=ax))

fig.tight_layout()
plt.show()