
Ruled Surfaces
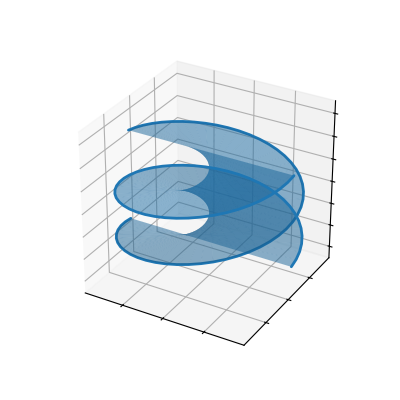
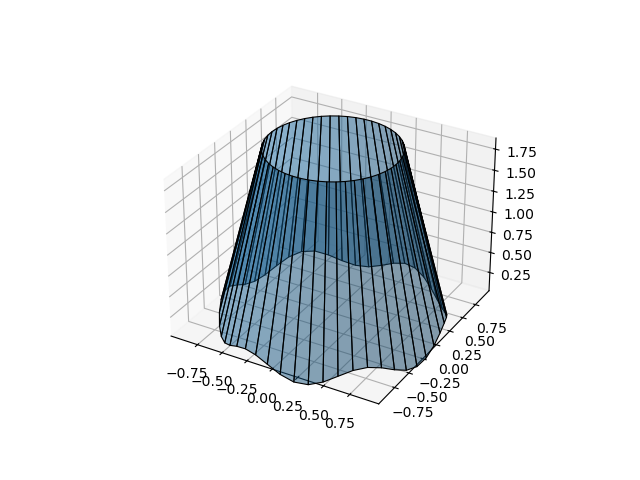
The above figure is a comparison to the fill_between Matplotlib example. The figure below is a comparison to the Fill between 3D lines Matplotlib example.
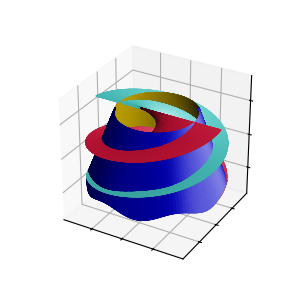
Numerous examples of ruled surfaces are given in Ruled Surfaces page. The surface construction difference between Matplotlib and S3Dlib is that Matplotlib uses 3D axis functions to construct specific surface plot types whereas S3Dlib constructs surface objects, then passes the objects to the 3Daxes. The object approach enables further surface developement, independent of the plot type. In this case, two line objects are then used to construct a surface object. These two surfaces are further developed and both shown on the same axis in the following figure, with the code given in the Inner and Outer Composite Surface Coloring example.
Code for the fill between figure:
import numpy as np
from matplotlib import pyplot as plt
import s3dlib.surface as s3d

#.. fill_between(x1, y1, z1, x2, y2, z2) Matplotlib example
# 1. Define function to examine .....................................

def func_one(t) :
    theta = 2*np.pi*t
    x1 = np.cos(theta)
    y1 = np.sin(theta)
    return x1,y1,t

def func_two(t) :
    theta = 2*np.pi*t
    x2 = np.cos(theta + np.pi)
    y2 = np.sin(theta + np.pi)
    return x2,y2,t

# 2. Setup and map line .............................................
rez = -50
line_1 = s3d.ParametricLine(rez,func_one,lw=2,color='C0')
line_2 = s3d.ParametricLine(rez,func_two,lw=2,color='C0')

surface12 = line_1.get_surface_to_line(line_2)
surface12.set_surface_alpha(.5)

# 3. Construct figure, add surface, and plot ........................
fig = plt.figure(figsize=(4,4))
ax = plt.axes(projection='3d', aspect='equal')

ax.set(xticklabels=[],  yticklabels=[], zticklabels=[])
s3d.auto_scale(ax,surface12,uscale=.85)

ax.add_collection3d(surface12.shade())
ax.add_collection3d(line_1)
ax.add_collection3d(line_2)

plt.show()
Code for the fill between 3D Lines figure:
import numpy as np
from matplotlib import pyplot as plt
import s3dlib.surface as s3d

#.. Fill between 3D lines Matplotlib example
# 1. Define function to examine .....................................

def func_three(t) :
    theta = 2*np.pi*t
    x1 = np.cos(theta)
    y1 = np.sin(theta)
    z1 = 0.1 * np.sin(6 * theta)
    return x1,y1,z1

def func_four(t) :
    theta = 2*np.pi*t
    x2 = 0.6 * np.cos(theta)
    y2 = 0.6 * np.sin(theta)
    z2 = 2*np.ones(len(t))  # Note: arrays are the same size, not a scalar
    return x2,y2,z2

# 2. Setup and map line .............................................
rez=-50
line_3 = s3d.ParametricLine(rez,func_three)
line_4 = s3d.ParametricLine(rez,func_four)

surface34 = line_3.get_surface_to_line(line_4)
surface34.set_surface_alpha(.5).shade(.5)
surface34.set_linewidth(.8)
surface34.set_edgecolor('k')

# 3. Construct figure, add surface, and plot ........................
fig = plt.figure()
ax = plt.axes(projection='3d')
s3d.auto_scale(ax,surface34,uscale=.85)

ax.add_collection3d(surface34)

plt.show()